This is the first in a series of posts on using InfoPath. You will find links to the others at the end of this post.
I find on many occasions that users have a need to capture some pieces of information but don’t want to build an application to capture it. SharePoint lists can be a useful way to capture this data, if you plan carefully and use best practices. At times users need to control several different pieces of related information, and would like to use information from one SharePoint list or SQL Server table as a pick list or drop down in another SharePoint list. This can be effective if you put the right controls in place to keep the data in synch and to maintain data integrity.
You could use a SharePoint Lookup column in your list to keep this data in synch, but doing so can have complications. I avoid Lookup columns as a rule, since they store the underlying values as a mash up of SharePoint ID and description, looking something like 12;#Description. When you pull this into your database you have to do some work to get the data into useable form. And if you want to refer to or display any other information from the lookup list into the cascaded list using InfoPath you can’t do it. What I prefer to do store is the ID of the item (sometimes the SharePoint ID and sometimes the underlying ID from the data warehouse), and use InfoPath to get the description of the item and any other relevant fields. I then use the ID for any joins on the data warehouse side of things, and I use SSIS to keep the descriptions updated across the cascading lists. So if Vendor Name got updated in a lookup list, I would join on the ID and use SSIS to update the description in any cascaded lists, since we are not using a SharePoint Lookup column to do this for us.
A combination of SharePoint column settings, InfoPath and SSIS is a great way to put the required controls in place. It takes a bit to get the hang of it, but it has a lot of flexibility to enforce data integrity and to keep the descriptions in synch between lists. The only drawback to using InfoPath forms is that users can no longer use the Datasheet View to enter and update data. With large lists this can be a problem for users, so you need to decide if Datasheet View is a requirement for your users before using InfoPath forms.
When I design a cascading list scenario, I like to build the underlying SQL tables and report first, get the structures exactly as needed, and then build the SharePoint lists based on the existing table structures. Without doing this, a lot of changes can be discovered along the way, and having to go back and change the SP List, SSIS Package, SQL tables and reports is not an efficient use of time. Best to build the tables and report, hammer out the correct structures and build the SharePoint lists and InfoPath forms on top of that.
For the step-by-step I will build 4 lists where users can enter data to control a department scorecard. These 4 lists will be used to populate these 5 tables which have already been defined:
DIM_Supply_Chain_Goal

DIM_Supply_Chain_Section

DIM_Supply_Chain_Metrics

FACT_Supply_Chain_Target

FACT_Supply_Chain_Actual

I won’t be showing you the SSIS packages to populate these tables, as that is another subject. I am simply demonstrating how to can use SharePoint lists to capture data with a good user experience. You can then use these lists to populate underlying tables of a different structure using SSIS. For more details on pulling the data out of SharePoint lists using SSIS please see my previous post – How to use a SharePoint list as a data source in your SSIS package.
Users will be able to update the values for these tables from SharePoint using InfoPath forms. SSIS will be used to import the data into SQL Server and populate these tables. The end result will be a department scorecard where users can control the values for actuals and targets, as well as the sort order of all of the goals, sections and metrics. Some of the actuals will be calculated by SSIS using data from an ERP system, and some will be user controlled. The targets are all user controlled. And the descriptions and sort order of Goals, Sections and Metrics are user controlled.
The lists are designed with the best user experience in mind, rather than building them to match the underlying tables. Some data transformation will be done by SSIS to extract the data from the lists and load it in the correct format into the tables.
SharePoint List creation, best practices:
Column Settings: The first step is to create the SharePoint lists which will feed the tables above. It is important to match the data types in the list to those in your underlying tables as closely as possible, but only for those columns that the user will be editing. For example if you are expecting the Goal field to have no more than 50 characters, then put that restriction on the column in your list.
For any calculated columns which are concatenations of fields, leave the default of 255 characters, since you may not know exactly which fields you will be concatenating yet.
For user Sort Order fields, make them Number type with 0 decimal places and choose a maximum value so you know how many leading zeros you will need to add to the ListSort column. More on that later.
When it comes to storing something like Year, you’ll want to make this a text field, since the display of Number will put a comma for thousands. So 2012 would look like 2,012. You could either have 2 fields for year in your list, one for display and one for the value to be sent to the data warehouse which makes sense in the case where a user could key in the number, or you could use a dropdown to control what the user can choose – store the value as a string, and then convert it on the way into the data warehouse.
Column naming convention: When naming your fields don’t put any spaces, The underlying name for that column captured behind the scenes will have special characters added in place of the spaces. When you get to SSIS this can be annoying. Avoid spaces when first naming the field, and then go back and rename the field with the space. The original value will be retained underneath the hood, but users will to see the space on the List View making the user experience better. for example, name the column Sort_Order when you first create it, and then go back and change it to Sort Order. You only need to rename those columns which will be visible in the List View, since this is strictly for user experience.
Built-in columns for display descriptions, sort order, item uniqueness and item title: Some additional best practices I have adopted for data integrity and for flexibility in changing logic without changing underlying structures is to add some calculated columns.
ItemDescription – The description stored in this column can be pulled into cascading lists to get the full description displaying in the list downstream. I have InfoPath populate it with whatever combination of descriptors make the most complete description of that list item to be displayed downstream.
UniqueItem – Be sure to check off Enforce Unique Values when creating the UniqueItem column. Since we are using InfoPath to control the user experience it makes sense to put all the logic to populate these fields in InfoPath, rather than creating calculated columns in our list. We will concatenate the appropriate combination of data to define a unique list item, and the Enforce Unique Values property will throw an error if a user tries to create a duplicate item.
ListSort – I also add a column called ListSort in which I can place the combination of values by which the list view should be sorted. SharePoint only allows you to sort a list view by up to two values. By concatenating the combination of values into one field it makes it very easy to sort your list. If you will also be including a numeric Sort_Order field which users can control, be sure to set a maximum value that they can enter. This will be important when you use this Sort_Order to populate your ListSort fields downstream in the cascading lists. For example if you are sorting your Section list by the Goal sort and then the Section name, you will need to concatenate these fields. SharePoint sorts numbers stored in a text field as text, so the numbers 1,50 and 100 would be sorted as 1, 100, 50. Since we are using the ListSort text field as our best practice for all lists, we will want to add some leading zeros to the Sort_Order when populating the ListSort. The maximum value will tell you how many leading zeros to add. If your maximum value is 999, you will need to add up to 2 leading zeros. As a best practice make the maximum value for your Sort_Order 999,999 and concatenate 6 leading zeros. This will become clear in our example.
Title – I also prefer to leave the Title column as a calculated field, to be a combination of one or more of the values a user will enter into the list. This gives me complete flexibility to have the Title reflect a good description of the list item without restricting that description to only one field in the list which a user may key in. Keep this at default size of 255 since it may be a concatenation of fields.
You end up with 4 additional calculated columns in your list, and although in some cases they may all contain the same information, you have built in the flexibility to change display descriptions, sort order, item uniqueness and item Title without have to change the structure of your list or the SSIS packages. You can change the logic in the InfoPath form without having to touch the underlying structures.
Create the SharePoint Lists:
List 1. Supply Chain Scorecard Goal
Change the Title field to Goal, and add a column called Sort_Order of type Number with 0 decimal places. To enforce the data integrity, require this field to have information and Enforce unique values.

After you save the Sort_Order column, go back and rename it to Sort Order (with a space). The end result is a list with 4 columns, Item (title), Goal, Sort Order, and UniqueItem. While this particular list may not need the addition of Item and UniqueItem, since Item, Goal and UniqueItem may all end up being the same value – it is good design to include all three columns to give you the flexibility to change it later.

List 2. Supply Chain Scorecard Section

List 3. Supply Chain Scorecard Metrics

List 4. Supply Chain Scorecard Actuals

Modify the List View:
Go back and remove any columns from the List View which you do not want the users to see – including UniqueItem and ListSort, reorder the columns as required, and set the view to sort by ListSort.
Do this by selecting your list, clicking on the List tab in the SharePoint menu and selecting Modify View.

Deselect any items you don’t want to show up in the view. Reorder by changing the Position from Left dropdown.

In the “First Sort by the column:” drop down select the ListSort column.

Do this for all of the lists.
Edit the First InfoPath Form:
Start with the first pick list in the cascade of lists. The one that does not depend on any of the other lists. It would be the highest level in the hierarchy of the cascade, in this case Supply Chain Scorecard Goal. This list does not choose a value from any other list, but the Supply Chain Scorecard Section list will use the Goal list as a pick list.
InfoPath Form 1. Supply Chain Scorecard Goal
Although this list does not depend on any of the others, we would like to use InfoPath to allow users to edit the two editable fields – Goal and Sort Order, and have InfoPath populate the underlying calculated fields of Title, ItemDescription, UniqueItem and ListSort. In this case the list is a very simple one, so each of these 4 calculated fields will contain just one value – Goal. The list will be sorted by Goal, the uniqueness of the list will allow only one row for each Goal description, the title will display the Goal and the description passed on to the cascading lists will be Goal.
Open your list. In the SharePoint menu go to the List tab and select Customize Form.

A dialog box will ask if you would like to open the form in Microsoft InfoPath. Click OK. InfoPath will open, and the default form for your list will appear with all of the underlying fields on it.

For the calculated fields which the user does not need to see, highlight the row

and click delete.

Now only the two fields remain, which the user will populate.
UNIQUEITEM
To populate the calculated fields look at the Fields pane on the right hand side of the screen. Right click on the UniqueItem field and select Field Properties.

Beside the Default Value click on the expression editor button

Click on the Insert Field or Group button

Select the Goal field and click OK.

Your formula now looks like this:

Click OK. Make sure the checkbox is checked which says “Refresh value when formula is recalculated”. This will ensure that each time the Goal description is changed, the UniqueItem value will also be updated to the new Goal description.

Click OK. For now, repeat this for each of ItemDescription, Title and ListSort. Be sure that you populate all four calculated fields correctly before going to the next step, since we have required that these fields be populated. If they are blank you will not be able to add any items to your list.
Click on the InfoPath File menu and click the Quick Publish button. This will publish your changes back to SharePoint.

Now you can add some items to your list. You will need to do this to have some data for the next step, which is to edit the InfoPath form for the cascading SharePoint list. You will want to test that it is working, so you need to have at least one item in the Goal list. Add some items – add Goal = Improve, Sort Order = 1. Now add Goal = Improve, Sort Order = 2. Notice that you get an error message stating that there is a duplicate value for UniqueItem. We selected Enforce unique values on the UniqueItem column to ensure users do not accidentally enter duplicate items. UniqueItem lets you control what constitutes a unique value.

Click OK and change the Goal = Maintain. Save the item. Add one more item – Goal = Track, Sort Order = 3. Your list is now complete.
TITLE
Take a look at the List View. Notice how the Title is aligned to the left and Sort Order is to the extreme right. This doesn’t seem like the best user experience.

Let’s change the logic in our InfoPath form to make the Title calculation a concatenation of Sort Order and Goal. Then we can remove the Sort Order field from our List View.
Go back to the InfoPath form you edited. It should still be open. In the Fields pane on the right hand side of the screen right click on the Title field. Select Field Properties. Click on the expression editor button for the Default Value. Delete the current formula which says Goal. Click on the Insert Function Button.

Select the Text Category and then select the concat Function.

Click OK. You can double click where it tells you, but we are going to delete everything after concat( and then click on the Insert Field or Group button. Select the Sort Order field. Type a comma. Type “ – “. Type a comma. Click the Insert Field or Group button. Select the Goal field. Type a close bracket. You should end up with this formula.

Click OK.
Publish the Form. File –> Info –> Quick Publish.
Go back to your SharePoint list. The changes to the title will not take effect until the Goals are edited. Open the Edit window for each of the three items in your list and save the items. The Title has changed to the new value.

Modify the view and remove the Sort Order field from the View, since it is now part of the Title.
ITEMDESCRIPTION
In your downstream cascading lists you will want a good description of your item. It may be the same as Title, but it may not. By having this field in place as a best practice, you can control how it will look.
For now we will leave the ItemDescription = Goal.
LISTSORT
Since we want the List to sort by the numeric value of Sort Order, and want to keep with our best practices of using ListSort as our standard sorting mechanism which will also be used downstream, we need to edit the calculation for ListSort. If we leave the view to sort by ListSort as it is now, it will sort alphabetically by Goal.
Open your InfoPath form if it is not already open. Right click on the ListSort field and select Field Properties. Click on the expression editor button for the Default Value. Click on the Insert Field or Group button and choose Sort Order. Click OK. Your formula should look like this.

Click OK, OK and publish the form. Go to your list and for each item in turn select Edit Item, and then Save. The ListSort values will not get updated with the new value until the items are edited, since the value is only refreshed when the formula gets recalculated. Add a new item to your list, Goal = Test Sort Order = 11. Since ListSort is a text field the list is sorting alphabetically by the Sort Order value we put in the ListSort field. This does not give the desired results since numbers stored in a text field get sorted like this:

At this point you might decide to just change the sort order on your list to use the Sort Order field, but when you want to use this downstream in your cascading lists you are going to want to be able to sort by a concatenation of Goal sort order and other sort orders which may not be numeric. For example you might want to sort the Section list by the Goal sort order and then the Section description. We can do this by adding some leading zeros to the Sort Order value when storing it in the ListSort.
Go back to your InfoPath form. Right click on the ListSort field and select Field Properties. Click on the expression editor button for the Default Value. Create the following formula using the Insert Function button and the Insert Field or Group button. You can type in the functions, but must select the Sort Order field using the Insert Field or Group button.
substring(concat("000000", Sort Order), string-length(string(Sort Order)) + 1, 6)
Notice that we are adding 6 leading zeros to the Sort Order value and then choosing the last 6 characters of the resulting value. Your formula should look like this.

Notice that we didn’t have to change the data type or structure to implement this change to the value in ListSort, but simply changed the logic. Now go back and Edit and Save each of the items in the list. Notice that they sort correctly now.

Use the First SharePoint list as a Pick List in the Second Cascaded List:
Close InfoPath if it is still open, and navigate to your second list – Supply Chain Scorecard Section. This list will use the Goal SharePoint list as a pick list.
Open the list, navigate to the List tab and click on the Customize Form button on the SharePoint menu. Click OK on the message. Highlight and delete the rows in the form for Title, Goal, ItemDescription, UniqueItem and ListSort. Edit the label on the form for Goal ID to Goal, and Display Toggle to Display. You should end up with a form that looks like this:

LOOKUP AND STORE ID FROM ANOTHER LIST
In the text box for Goal ID on the form, right click and select Change Control –> Drop-Down List Box.

Right click on it again and select Drop-Down List Box Properties.

Click on the radio button Get choices from an external data source. Click on the Add button beside the Data Source.

Leave the default values of Create a new connection to Receive data.

Click Next. Select SharePoint library or list.

Click Next. Using Internet Explorer navigate to your Goal list. Copy the URL and scrape out anything to the right of and including Lists. This is the SharePoint site where the list is stored. Enter this value in the Data Connection box.

Click Next. Select the Supply Chain Scorecard Goal list.

Click Next. Select all of the fields you created, and sort by ListSort. You will be using more than one field from this list, and it is easiest if you have already included the fields in your data connection.

Click Next, Next and Finish. In the Value field of the Drop-Down List Box Properties window click on the Tree button. Select ID. You will be storing the SharePoint ID of the Goal in the Goal_ID field of your Section list. Change the Display name to ItemDescription.

Click OK. This will store the ID, but display the ItemDescription to the user in the InfoPath form.
LOOK UP DESCRIPTIONS FROM THAT LIST
We would also like to store the ItemDescription so we can display it in our list, and for that we need a calculated field to go and fetch the description matching the ID now stored in the Goal_ID field.
In the Fields pane right click on the Goal field and select Field Properties. Click on the expression editor beside the Default Value. Click on the Insert Field or Group button. Click on the Show advanced view link.

In the Fields drop down change the data connection to the Supply Chain Scorecard Goal connection you created when populating the Goal ID.

Open up the dataFields toggle and the SharePointListItem_RW toggle. Select ItemDescription. This is where the best practices come in handy, since we already know that this field was created specifically to display a useful description in cascaded lists. Now, DON’T CLICK OK. This is something you have to get used to. You need to filter the data first to get the corresponding Goal description which goes with the Goal ID already stored in your list. If you make a mistake and click okay now, you will have to go back and navigate the data connections again. It doesn’t remember where you were in the tree. Click on the Filter Data button.

Click on the Add button to add a filter. In the first drop down select the ID column. You are building an expression that will find the ItemDescription that corresponds to the ID stored in your main data connection. Leave the middle drop down as ‘is equal to’. Select the third drop down. Click on ‘Select a field or group’.

In the Fields drop down navigate to the Main data connection.

Open up the dataFields toggle and the SharePointListItem_RW toggle. Select the Goal ID field.

Click OK. Your filter condition looks like this:

Click OK. Your Filter Data looks like this:

Click OK and OK again. Your formula looks like this.

Please note that you couldn’t just type this expression into the box because the context of the data connection is stored within the filter. If you are interested you can select the Edit Xpath checkbox to can see the underlying code.
Click OK. The field properties looks like this.

Be sure that the Refresh value checkbox is selected. Click OK.
POPULATE THE CALCULATED FIELDS
Just as we did for the Goal SharePoint list, we also need to populate the calculated fields in this list.
A UniqueItem for this list will be a combination of Goal ID and Section name, since we could potentially have a Section of the same name in more than one Goal.

Title will be just Section

ItemDescription, to be used downstream, will be Goal plus Section

ListSort needs to incorporate the ListSort of Goal as well as the ListSort for Section. If a user were to change the sort order of the goals, we would want the Section list to be reordered accordingly. So we need to go and get the ListSort for Goal, and then concatenate it with our formula ListSort.
Right click on the ListSort field and paste our formula into the Formula box.
substring(concat("000000", Sort Order), string-length(string(Sort Order)) + 1, 6)
Delete the first reference to Sort Order and replace it by clicking on the Insert Field or Group and selecting Sort Order. This will put the XPath context of Sort Order into the formula.

Do the same with the second instance of Sort Order. Your formula should look like this.

We want to concatenate the ListSort value from our Goal in front of this formula. Type “concat( , “ at the beginning of the Formula window and add a “)” bracket at the end of the formula. Put the cursor after the “(“ . You are about to insert the ListSort value for Goal into the formula so the cursor must be in the right position. Your formula looks like this – cursor is highlighted in red.

Click on Insert Field or Group. We are going to follow the same steps we used to get the Goal description. In the Select a Field or Group window select Show advanced view.

In the Fields drop down change the data connection to the Supply Chain Scorecard Goal connection you created earlier.

Open up the dataFields toggle and the SharePointListItem_RW toggle. Select ListSort. This is another spot where the best practices come in handy, since we already know that this field was created specifically to sort the goal list. Now remember, DON’T CLICK OK. You need to filter the data first to get the corresponding Goal description which goes with the Goal ID already stored in your list. If you make a mistake and click okay now, you will have to go back and navigate the data connections again. It doesn’t remember where you were in the tree. Click on the Filter Data button.

Click on the Add button to add a filter. In the first drop down select the ID column. You are building an expression that will find the ListSort that corresponds to the Goal ID stored in your main data connection. Leave the middle drop down as ‘is equal to’. Select the third drop down. Click on ‘Select a field or group’.

In the Fields drop down navigate to the Main data connection.

Open up the dataFields toggle and the SharePointListItem_RW toggle. Select the Goal ID field.

Click OK. Your filter condition looks like this:

Click OK. Your Filter Data looks like this:

Click OK and OK again. Your formula looks like this.

Click OK and OK again. Publish your form.
Go to your Section list and add a few items. Notice that even if you put a lower Sort Order with a Maintain goal it gets sorted after the Improve goal.
Use the Second SharePoint list as a Pick List in the Third Cascaded List:
I’m not going to do as much detail on the screenshots for this one, since a lot of it is rinse and repeat. I’ll tell you the steps.
- Navigate to the third SharePoint list – Supply Chain Scorecard Metrics.
- Open the InfoPath form by clicking on the Customize Form button in the List menu.
- Remove all the rows in the form except for Metric, Section ID, Site, UOM and Sort Order.
- Set up the Section ID lookup:
- Edit the Section ID label to say “Section” and right click on the textbox and Change the Control to a Drop-Down List Box.
- Right click again and select Drop-Down List Box Properties. Select Get choices from an external data source
- Click the Add button beside the Data source.
- Create a new connection to Receive data.
- From a SharePoint library or list
- Enter your SharePoint site URL
- Select the Supply Chain Scorecard Section list.
- Select all of the fields that you created. Sort by ListSort.
- Next and Finish.
- Change the Value field to ID and the Display name to ItemDescription. Click OK.
- Edit the Section field properties.
- Right click Section, Field Properties.
- Click on the expression builder button beside Value.
- Click on Insert Field or Group. Click on Show Advanced View.
- Select Supply Chain Scorecard Section. Navigate to dataFields and then to ItemDescription.
- Click on Filter Data.
- Click on Add.
- Select ID in the first drop down, leave “is equal to” in the second drop down.
- In the third drop down choose Select a field or group. Change the data connection in the drop down to Main. Navigate to Section ID. Click all of the OKs.
- Edit the Title field properties. Concatenate the Metric and Site field.
- Edit the ItemDescription field properties. Concatenate Section and Metric and Site.
- concat(Section, " – ", Metric, " ", Site)
- Edit the UniqueItem field properties. Concatenate the Metric and Site field.
- Edit the ListSort field properties. It will end up looking like this: concat( ListSort[ID = Section_ID] ,substring(concat("000000", Sort Order), string-length(string(Sort Order)) + 1, 6))
- Enter the formula for the List Sort and set up to concatenate the Section List Sort field to the beginning of it.
- concat( <insert Section List Sort here> ,substring(concat("000000", Sort Order), string-length(string(Sort Order)) + 1, 6))
- Show advanced view. Select the Supply Chain Scorecard Section data connection.
- Navigate to dataFields and select ListSort.
- Select the Filter Data button. Click Add.
- Select ID in the first drop down, leave “is equal to” in the second drop down.
- In the third drop down choose Select a field or group. Change the data connection in the drop down to Main. Navigate to Section ID. Click all of the OKs.
- Publish the InfoPath form.
Navigate to your list and add some items. All should be working as expected.
Use the Third SharePoint list as a Pick List in the Fourth Cascaded List.
This is almost a repeat of the last section. The difference is that the user will not be choosing a sort order. The Supply Chain Scorecard Actuals list will contain the Metrics for each year. This means the ListSort will be based on Year and Metric ListSort. UniqueItem will be based on Year and Metric ID. ItemDescription won’t be important because there will be no other lists downstream from this one. I’ll write out the steps just as a refresher.
- Navigate to the fourth SharePoint list – Supply Chain Scorecard Actuals.
- Open the InfoPath form by clicking on the Customize Form button in the List menu.
- Remove the following rows from the form: Title, Metric, UOM, ItemDescription, UniqueItem, ListSort.
- Set up the Metric ID lookup:
- Edit the Metric ID label to say “Section” and right click on the textbox and Change the Control to a Drop-Down List Box.
- Right click again and select Drop-Down List Box Properties. Select Get choices from an external data source
- Click the Add button beside the Data source.
- Create a new connection to Receive data.
- From a SharePoint library or list
- Enter your SharePoint site URL
- Select the Supply Chain Scorecard Metrics list.
- Select all of the fields that you created. Sort by ListSort.
- Next and Finish.
- Change the Value field to ID and the Display name to ItemDescription. Click OK.
- Edit the Metric field properties.
- Right click Metric, Field Properties.
- Click on the expression builder button beside Value.
- Click on Insert Field or Group. Click on Show Advanced View.
- Select Supply Chain Scorecard Metrics. Navigate to dataFields and then to ItemDescription.
- Click on Filter Data.
- Click on Add.
- Select ID in the first drop down, leave “is equal to” in the second drop down.
- In the third drop down choose Select a field or group. Change the data connection in the drop down to Main. Navigate to dataFields and then to Metric ID. Click all of the OKs.
- Edit the Title field properties. Set it to equal Metric.
- Edit the ItemDescription field properties. Set it to equal Metric.
- concat(Section, " – " , Metric)
- Edit the UniqueItem field properties. Set it equal to the Year + Metric ID field.
- Edit the ListSort field properties. It will end up looking like this: concat(Year, ListSort[ID = Metric_ID])
- Enter the formula “concat (“, click on the Insert Field or Group button and select the Year field. Key in a comma some space and a “)”. Place the cursor right before the close bracket. You will insert the Metrics ListSort field here.
- concat( Year, <insert Metric ListSort here> )
- Show advanced view. Select the Supply Chain Scorecard Metrics data connection.
- Navigate to dataFields and select ListSort.
- Select the Filter Data button. Click Add.
- Select ID in the first drop down, leave “is equal to” in the second drop down.
- In the third drop down choose Select a field or group. Change the data connection in the drop down to Main. Navigate to Metric ID. Click all of the OKs.
- Publish the InfoPath form.
Navigate to the list. Add an item.
Display a Look up field on the Form:
You notice that it would enhance the user experience to be able to see the UOM beside the Target, Thresholds and Monthly Actuals on the form when editing or adding an item. We will look up the UOM and keep it on the form as a ‘display only’ so when the user is entering the targets and actuals they will be aware of the UOM for the Metric.
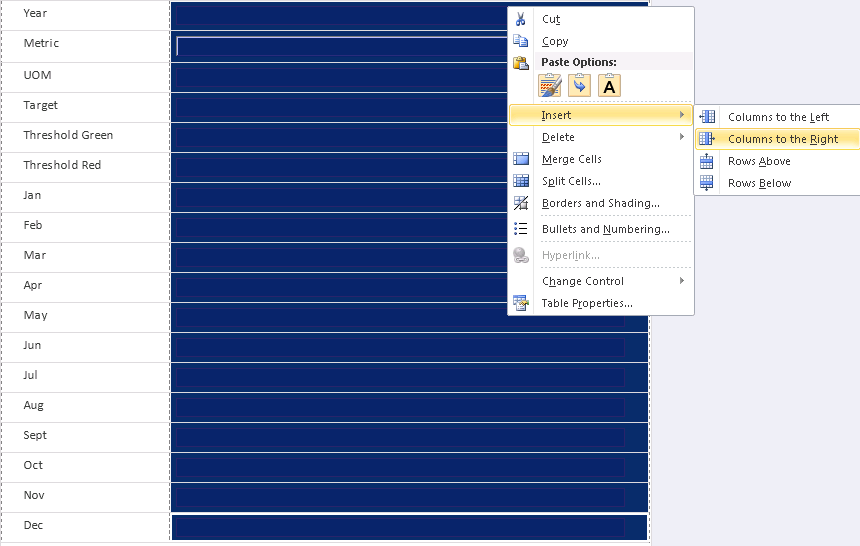
Highlight the entire right hand column, right click and select Insert –> Columns to the Right.

Drag the left edge of the new column to make it smaller. Drag the UOM field from your Fields list onto the form, in the cell beside Target. Delete the Label that says UOM beside the textbox you dragged onto the form.

Right click on the textbox and select Text Box Properties. On the Data tab click on the expression editor button.

Click on the Insert Field or Group button. Click on Show advanced view, and in the dropdown at the top select the Supply Chain Scorecard Metrics data connection.

Navigate to dataFields and then to UOM. Click on Filter Data. Click on Add.
Select ID in the first drop down, leave “is equal to” in the second drop down. In the third drop down choose Select a field or group.

Change the data connection in the drop down to Main. Navigate to Metric ID.

Click all of the OKs until you get back to the Text Box Properties window. Click on the Display tab. Check off the Read-only box. Click OK.

Right click on the UOM text box you created and select Borders and Shading. Change Borders to None. Change the shading to No Color. This will make it look like part of the form, instead of as a text box which might be editable.
Right click on the UOM text box you created, and select Copy. Paste it into each of the cells where you would like to display the UOM on the form.

Publish the InfoPath form. Navigate to the list and add an item. Notice that as soon as you select a Metric the UOM appears beside all the textboxes to be populated with that metric by the user.

There are lots of other things you can do with InfoPath, but I think this is more than enough to get you started.
I have also blogged a few other related subjects while writing this post, since this one already covered so much. These two are a continuation of the example started here.
Use a SQL Server data source for an InfoPath pick list
Dynamically filter a drop down on your SharePoint list by another user selected value
You might also find this interesting:
How to use a SharePoint list as a Data Source in your SSIS Package
Maintaining Data Integrity of a SharePoint list with SSIS


