Promoting Excel Tabular Model to SSAS

PowerPivot for Excel is a fantastic addition to Microsoft’s Business Intelligence offering.  It provides a self-service capability for users to mash-up huge amounts of data from multiple sources, create advanced calculations that get refreshed alongside their pivot tables and the ability to very easily publish workbooks as web applications.  Excel users are already comfortable with the interface.  And the PowerPivot add-in is free for Excel 2010 and 2013 users. 

There are pros and cons to using any one of PowerPivot for Excel, PowerPivot for SharePoint, SSAS Tabular or SSAS multidimensional.  Melissa Coates has written a great article on when to use which type of model. While PowerPivot for Excel is a fairly robust and flexible tool for individual users, there are many reasons why you might promote an Excel Tabular model to SQL Server Analysis Services. 

PowerPivot for Excel can be a great starting point for users to decide what information they want to include in a model. It allows them to play with the data and refine the model until it houses the main information that they need to see on a regular basis, in a format they can easily consume.  What can happen is that the workbooks get emailed around and get out of synch between users.  Or the data gets too large and the model takes forever to refresh.  Or the in-memory calculations take too long to load.

When this happens you might want to promote your Excel Tabular model to SSAS, if your infrastructure supports it.  It means the flexibility for users to mash-up additional data is lost, but the gains in stability, scalability, security and other features can be well worth the move.  Microsoft has made this promotion of a model very easy to do.

1. Create a new SSAS Project

Open up SQL Server Data Tools.  In the File menu click New and then Project.  In the New Project dialog box, under Installed Templates expand Business Intelligence and select Analysis Services.  On the right select Import from PowerPivot.

Browse for a location and enter a name for your project, and then click OK.

image_thumb1

In the Tabular model designer dialog you can enter the SSAS instance you will use for model.  It will need to be an SSAS instance running in Tabular mode.

image_thumb3

In the Open dialog box select the PowerPivot model for Excel that you will be converting to SSAS.

image_thumb5

It will take a minute or two to load the model into the project.

2. Check and refine your model

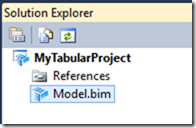
In the solution explorer, double click on the Model.bim top open up the imported model. 

image_thumb6

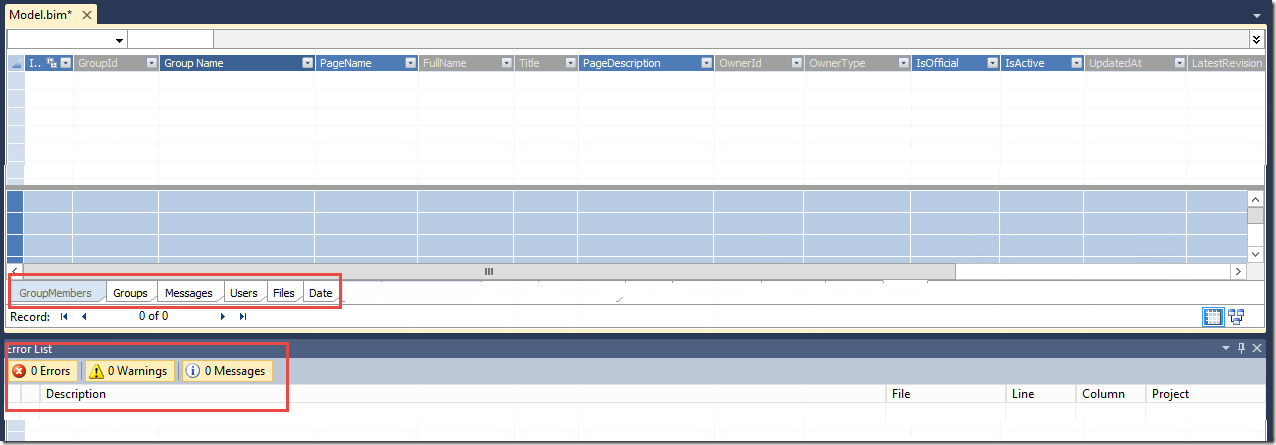
You will see the tabs similar to the PowerPivot model near the bottom of the screen, and any warnings, errors or messages. 

image_thumb8

Here you can do any edits to your model.  The interface is very similar to PowerPivot.  You can delete, hide or show data tabs from Client Tools by right clicking on the tab. 

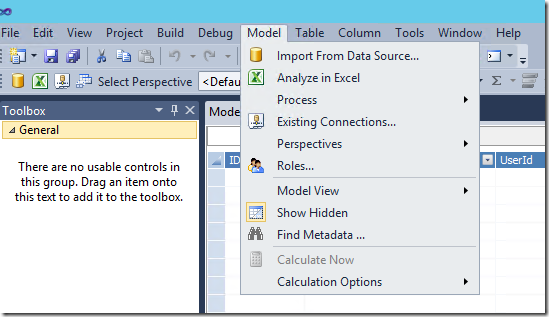
You can manage the model from the Model menu.

image_thumb12

You can edit the table properties and manage the relationships from the Table menu.

image_thumb10

You can add, edit and manage calculations and columns within the table tab.

image_thumb14

3. Deploy the Model to Analysis Services

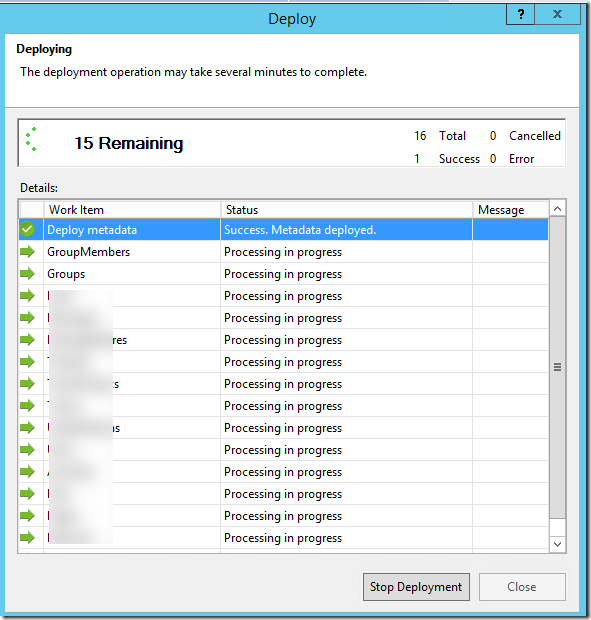
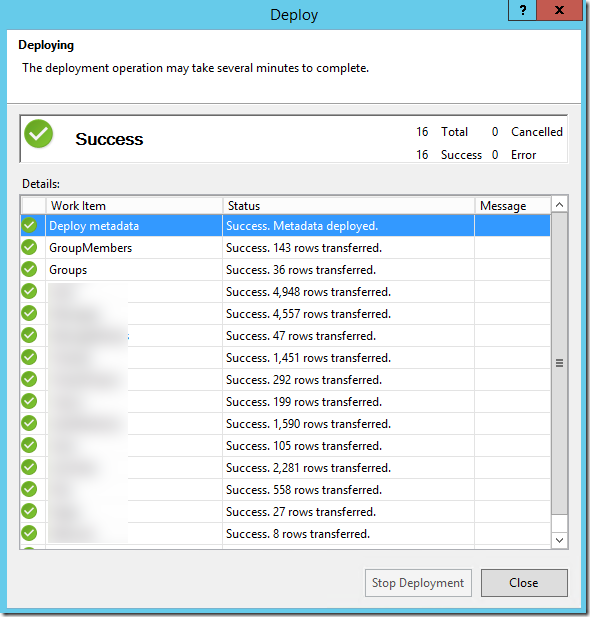
From the Build menu, you can build and deploy your model.  You can troubleshoot any deployment issues by following the error messages that pop up in the Deployment dialog in the Message column.

SNAGHTML103f7068_thumb1

image_thumb16

4.  Connect to your SSAS Tabular Model

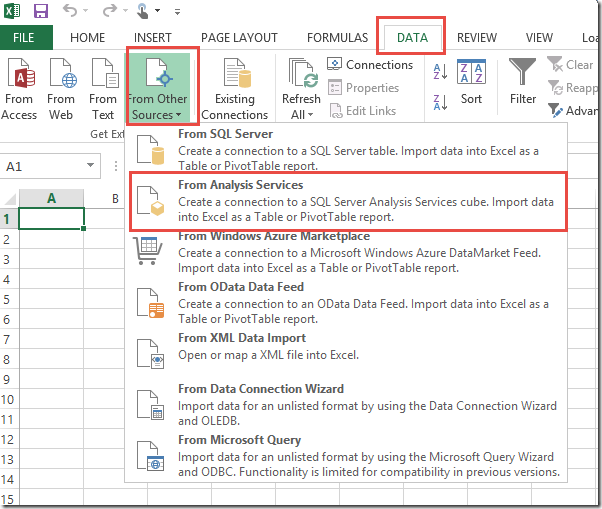
You can connect to the model through Excel or SSMS or any other client tool that can consume an SSAS model.  In Excel, you won’t be using PowerPivot, rather you will be using the SSAS Tabular model as a direct data source.

In Excel, click on the Data tab, click on From Other Sources and then From Analysis Services.

image_thumb22

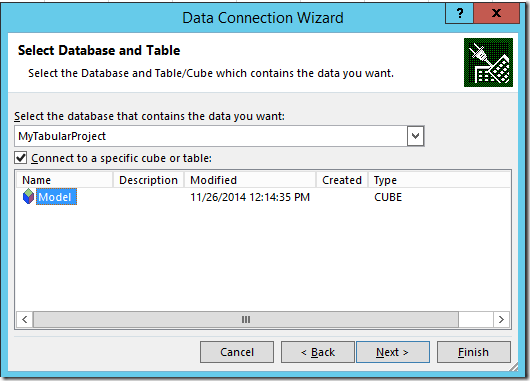
Enter the server name where you deployed your model, then select the database and model that you deployed.

image_thumb24

You can now use this as a classic Pivot Table data source.


I’ve noticed that the Tabular model is not as robust or responsive as the multi-dimensional model when you get to larger sets of data.  This is because it does everything in memory.  The converse of this is also true for smaller sets.  Because it is in-memory it can retrieve information and do calculations more quickly for smaller data sets.  Multi-dimensional models have additional features that Tabular does not have.  Richard Lees did an interesting comparison of Tabular vs Multidimensional.

As mentioned at the beginning of this article, the flexibility of PowerPivot can be exchanged in favour of the stability and scalability of a traditional SSAS deployed model.  Having users develop their own tabular models in PowerPivot and then have I.T. manage and deploy it to a wider audience allows for a great partnership and a quick development cycle.

How to Automate SSAS Cube Partitioning in SSIS

I have a client whose data is large enough that their cube needs to be partitioned monthly.  This process needed to be automated.  I would like to thank Vidas Matelis for posting the scripts he used to do this, here.  I started with his scripts and changed a number of things to get it to work in my environment.  This is done in SQL 2008. Here is how it works.

1.  Create schema and tables to hold the partition definitions
USE [yourdatabase]
GO

CREATE SCHEMA [config] AUTHORIZATION [dbo]
GO

CREATE TABLE [config].[SSASPartitions](
    [CubeName] [varchar](100) NOT NULL,
    [MeasureGroup] [varchar](100) NOT NULL,
    [Partition] [varchar](100) NOT NULL,
    [SQL] [varchar](3000) NOT NULL,
    [MinDateKey] [int] NOT NULL,
    [MaxDateKey] [int] NOT NULL,
    [NeedsReProcessing] [bit] NOT NULL,
    [LastProcessDate] [smalldatetime] NULL,
 CONSTRAINT [PK_SSASPartitions] PRIMARY KEY CLUSTERED 
(
    [CubeName] ASC,
    [MeasureGroup] ASC,
    [Partition] ASC
)WITH (PAD_INDEX  = OFF, STATISTICS_NORECOMPUTE  = OFF, IGNORE_DUP_KEY = OFF, ALLOW_ROW_LOCKS  = ON, ALLOW_PAGE_LOCKS  = ON) ON [PRIMARY]
) ON [PRIMARY]
GO

CREATE TABLE [config].[SSASPartitionsBase](
    [CubeName] [varchar](100) NOT NULL,
    [MeasureGroup] [varchar](100) NOT NULL,
    [FactTableName] [varchar](3000) NOT NULL,
    [PartitionFieldName] [varchar](100) NULL,
    [TableStartDateKey] [int] NULL,
    [LoadType1] [varchar](20) NULL,
    [LoadType2] [varchar](20) NULL,
    [LoadType3] [varchar](20) NULL,
 CONSTRAINT [PK_SSASPartitionsBase] PRIMARY KEY CLUSTERED 
(
    [CubeName] ASC,
    [MeasureGroup] ASC
)WITH (PAD_INDEX  = OFF, STATISTICS_NORECOMPUTE  = OFF, IGNORE_DUP_KEY = OFF, ALLOW_ROW_LOCKS  = ON, ALLOW_PAGE_LOCKS  = ON) ON [PRIMARY]
) ON [PRIMARY]
GO
2. Add Execute SQL tasks to populate the tables with Measure Group and Partition definitions

This is the first container in the package, which simply populates the tables created in step 1.

image

Add these Execute SQL Tasks to your SSIS package.

2a) Delete FROM SSASPartitionsBase

Delete FROM config.SSASPartitionsBase
2b) Insert Measure Groups

Below you will find some examples of rows to be inserted into the SSASPartitionsBase table.  This table is used as the base for building out the partition definitions.  You will need one record for each measure group in your cube, regardless of one or many partitions.  If you will require multiple partitions for a measure group, you must populate the PartitionFieldName and the TableStartDateKey so the script will know what SQL to write to define the partitions.

If you are pulling data into your cube using a query rather then directly from a table you must enter it here.

You may want to use LoadType if you will be defining different partitions for different data sets.  I am not using this because any of my measure groups that need multiple partitions will use the same periods for the partitions.  This will become clearer when we look at the Stored Procedure which populates the SSASPartitions table.

INSERT INTO config.SSASPartitionsBase
(
CubeName, 
MeasureGroup, 
FactTableName, 
PartitionFieldName, 
TableStartDateKey, 
LoadType1)

-----------------------------------------
--Single partition does not require PartitionFieldName or TableStartDateKey
-----------------------------------------

--FACT table with single partition
-----------------------------------------
SELECT 'Sales and Inventory' as CubeName, 
'Planning' as MeasureGroup, 
'FACT_Planning' as FactTableName, 
NULL as PartitionFieldName,
NULL as TableStartDateKey, 
'Planning' as LoadType1

UNION

--FACT table with multiple partitions
-----------------------------------------
SELECT 'Sales and Inventory' as CubeName, 
'Inv OH' as MeasureGroup, 
'FACT_Inv_OH' as FactTableName, 
'Date' as PartitionFieldName, --Required
'20070101' as TableStartDateKey, --Required
'Inventory' as LoadType1

UNION


--View on Fact Tables with multiple partitions
-----------------------------------------
SELECT 'Sales and Inventory' as CubeName, 
'Sales' as MeasureGroup, 
'vwFACT_Sales' as FactTableName, --Required
'Transaction_Date' as PartitionFieldName, --Required
'20070101' as TableStartDateKey, 
'Sales' as LoadType1

UNION

--Query on a FACT table with single partition
--no PartitionFieldName or TableStartDateKey
-----------------------------------------
SELECT 'Sales and Inventory' as CubeName, 
'Purchase Orders' as MeasureGroup, 
'(SELECT Expected_Receipt_Date, Product_ID, 
  SUM(Due_In_Quantity) AS Open_PO_DueTW_Quantity
  FROM FACT_PO AS PO WHERE (Due_In_Quantity > 0) 
  AND (Expected_Receipt_Date <= GETDATE()) 
  GROUP BY Expected_Receipt_Date, Product_ID) X' 
     as FactTableName,  
NULL as PartitionFieldName,
NULL as TableStartDateKey, 
'PO' as LoadType1
2c) Delete Current Open Period partitions

Because I have other SSIS packages that process the Open Period during the week, I need to have one partition in each multi-partition measure group that has a consistent name.  I have a naming convention like “Sales Current Open Period” or “Inv OH Current Open Period”.  The definition of the Current Open Period changes periodically, as a new monthly partition is created.  For example I might have a Current Open Period of Nov 1 to current day.  Let’s on November 30 a partition is saved off and the Current Open Period becomes Dec 1 to current day.  The Current Open Period partition needs to be dropped and recreated each time the script is run, to be sure that any new definition will be captured and processed.   Dropping it from the SSASPartitions table ensure that it will be reinserted with the updated definition.

Delete
  FROM [config].[SSASPartitions]
  WHERE Partition like '%Open Period'
2d) Update Process status of all partitions to be processed

Any single partition measure groups need to be reprocessed every time the script is run. We can identify these measure groups as those where MinDateKey=0.  This task flags these single partition measure groups to be processed.

  UPDATE config.SSASPartitions 
  SET NeedsReProcessing = 1 
  WHERE MinDateKey=0
2e) Execute sp_Execute_CalculateSSASPartitions to add any new partitions to the SSASPartitions table

This stored procedure kicks off a stored procedure which adds any new partitions to the SSASPartitions table.

EXECUTE sp_CalculateSSASPartitions 
Stored Procedure

This is the stored procedure which uses the SSASPartitionsBase table to populate the SSASPartitions table.

USE [yourdatabase]
GO

/****** Object:  StoredProcedure [dbo].[sp_CalculateSSASPartitions]    Script Date: 05/12/2014 15:45:17 ******/
SET ANSI_NULLS ON
GO

SET QUOTED_IDENTIFIER ON
GO


CREATE PROCEDURE [dbo].[sp_CalculateSSASPartitions]
WITH RECOMPILE 
AS 
BEGIN

SET NOCOUNT ON
PRINT 'Executing SP: CalculateSSASPartitions'

-- ---------------------------------------------------------------------------------------
-- ---------------------------------------------------------------------------------------
-- ---------------------------------------------------------------------------------------
--Create temp table
IF OBJECT_ID('tempdb..#tmpPart') IS NOT NULL DROP TABLE #tmpPart
CREATE TABLE #tmpPart (
CubeName varchar(100) NOT NULL
, MeasureGroup varchar(100) NOT NULL
, [Partition] varchar(200) NOT NULL
, [SQL] varchar(3000) NOT NULL
, MinDateKey int NOT NULL
, MaxDateKey int NOT NULL
)

-----------Partitions using Archive tables-----------
INSERT INTO #tmpPart(CubeName, MeasureGroup, [Partition], [SQL], MinDateKey, MaxDateKey)
SELECT 
P.CubeName, 
P.MeasureGroup,
P.MeasureGroup + ' ' + D.PartitionName AS Partition,
'SELECT * FROM ' + 
    CASE WHEN D.PartitionName = 'Current Open Period' THEN P.FactTableName ELSE P.FactTableName  + '_Archive' END
    + ' WHERE ' + P.PartitionFieldName
    + CASE WHEN MinDateKey = MaxDateKey THEN '=' + CONVERT(varchar, MinDateKey)
    ELSE ' BETWEEN ''' + CONVERT(varchar, D.MinDateKey) + ''' AND ''' + CONVERT(varchar, D.MaxDateKey) + ''''
    END
AS SQL,
CASE WHEN D.MinDateKey < P.TableStartDateKey THEN P.TableStartDateKey ELSE D.MinDateKey END AS MinDateKey,
D.MaxDateKey
FROM config.SSASPartitionsBase P
JOIN (
    --Add FiscalYear/Month partitions up to Closed Period
    SELECT CAST(FiscalMonthID as varchar) AS PartitionName, MIN(DateID) AS MinDateKey, MAX(DateID) AS MaxDateKey
        FROM DIM_Date
        WHERE FiscalYearID >= (SELECT DISTINCT FiscalYearID FROM DIM_Date WHERE TheDate = CAST(DATEADD(year, -3, GETDATE()) as Date))
        AND TheDate <= (SELECT MAX(ClosedDate) FROM DIM_Closed_Period WHERE DataArchived = 1)
        GROUP BY FiscalMonthID
    UNION ALL
    --Current Open Period
    SELECT 'Current Open Period' AS PartitionName, MIN(DateID) AS MinDateKey, MAX(DateID) AS MaxDateKey
        FROM DIM_Date
        WHERE TheDate > (SELECT MAX(ClosedDate) FROM DIM_Closed_Period WHERE DataArchived = 1)
        AND TheDate <= (SELECT  MAX(ClosedDate) as MaxClosedDate FROM DIM_Closed_Period)
) D ON D.MaxDateKey >= P.TableStartDateKey

WHERE P.MeasureGroup IN ('Inv OH Orig', 'Inv OH','Sales','Sales Customer','Sales Transaction','Sales Cost')
ORDER BY D.PartitionName

-- -------------------------------------------------
-- Add measure groups that will not be partitioned
INSERT INTO #tmpPart(CubeName, MeasureGroup, [Partition], [SQL], MinDateKey, MaxDateKey)
SELECT P.CubeName, P.MeasureGroup, P.MeasureGroup AS Partition
, 'SELECT * FROM ' + P.FactTableName AS SQL
, 0 AS MinDateKey, 999999 AS MaxDateKey
FROM config.SSASPartitionsBase P
WHERE ISNULL(PartitionFieldName,'') = ''

-- Safety. If we miss any measure groups, add records as if they were not partitioned.
INSERT INTO #tmpPart(CubeName, MeasureGroup, [Partition], [SQL], MinDateKey, MaxDateKey)
SELECT CubeName, MeasureGroup, MeasureGroup AS [Partition], 'SELECT * FROM ' + FactTableName AS [SQL]
, 0 MinDateKey, 999999 MaxDateKey
FROM config.SSASPartitionsBase B
WHERE NOT EXISTS(SELECT * FROM #tmpPart T WHERE T.MeasureGroup = B.MeasureGroup)
-- ----------------------------------------------------------------------------------------------------------------------------------

DELETE FROM config.SSASPartitions
FROM config.SSASPartitions P
JOIN config.SSASPartitionsBase B ON B.CubeName = P.CubeName AND B.MeasureGroup = P.MeasureGroup
WHERE
-- (B.LoadType1 = @Action OR B.LoadType2 = @Action OR B.LoadType3 = @Action) AND
NOT EXISTS(SELECT * FROM #tmpPart T WHERE T.CubeName = P.CubeName AND T.MeasureGroup = P.MeasureGroup
AND T.Partition = P.Partition)

PRINT 'Deleted partitions that do not exists in new list. Record count: ' + CONVERT(varchar, @@ROWCOUNT)

INSERT INTO config.SSASPartitions(CubeName, MeasureGroup, [Partition], [SQL]
, MinDateKey, MaxDateKey, NeedsReProcessing)
SELECT CubeName, MeasureGroup, [Partition], [SQL]
, MinDateKey, MaxDateKey, 1 AS NeedsReProcessing
FROM #tmpPart T
WHERE NOT EXISTS(SELECT * FROM config.SSASPartitions P 
WHERE P.CubeName = T.CubeName AND P.MeasureGroup = T.MeasureGroup
AND P.Partition = T.Partition
)

PRINT 'Inserted partitions that do not exists. Record count: ' + CONVERT(varchar, @@ROWCOUNT)
END

GO
3. Create Two Variables in your package

image

4.Add tasks to Drop, Create and Process Partitions

This is the second and final container that uses the information created in the first steps to actually drop, create and process any partitions which are new or which need to be reprocessed.

image

4a) Get DB Partitions List

image

image

SELECT CubeName,MeasureGroup, Partition, SQL, NeedsReProcessing 
FROM config.SSASPartitions 
ORDER BY 1,2,3
4b) Drop Older Partitions and Current Open Partitions

image

' Microsoft SQL Server Integration Services Script Task
' Write scripts using Microsoft Visual Basic 2008.
' The ScriptMain is the entry point class of the script.

Imports System
Imports System.Data
Imports System.Math
Imports Microsoft.SqlServer.Dts.Runtime
Imports System.Xml
Imports System.Data.OleDb
Imports Microsoft.AnalysisServices

<System.AddIn.AddIn("ScriptMain", Version:="1.0", Publisher:="", Description:="")> _
<System.CLSCompliantAttribute(False)> _
Partial Public Class ScriptMain
    Inherits Microsoft.SqlServer.Dts.Tasks.ScriptTask.VSTARTScriptObjectModelBase

    Enum ScriptResults
        Success = Microsoft.SqlServer.Dts.Runtime.DTSExecResult.Success
        Failure = Microsoft.SqlServer.Dts.Runtime.DTSExecResult.Failure
    End Enum
    

    ' The execution engine calls this method when the task executes.
    ' To access the object model, use the Dts property. Connections, variables, events,
    ' and logging features are available as members of the Dts property as shown in the following examples.
    '
    ' To reference a variable, call Dts.Variables("MyCaseSensitiveVariableName").Value
    ' To post a log entry, call Dts.Log("This is my log text", 999, Nothing)
    ' To fire an event, call Dts.Events.FireInformation(99, "test", "hit the help message", "", 0, True)
    '
    ' To use the connections collection use something like the following:
    ' ConnectionManager cm = Dts.Connections.Add("OLEDB")
    ' cm.ConnectionString = "Data Source=localhost;Initial Catalog=AdventureWorks;Provider=SQLNCLI10;Integrated Security=SSPI;Auto Translate=False;"
    '
    ' Before returning from this method, set the value of Dts.TaskResult to indicate success or failure.
    ' 
    ' To open Help, press F1.

    Public Sub Main()
        '--------------------------------------------------------------------------------------
        'THIS PACKAGE WILL DROP ANY MISSING PARTITIONS AND ANY "CURRENT OPEN PERIOD" PARTITIONS
        '--------------------------------------------------------------------------------------

        Dim ExecutionSuccessfull As Boolean = True ' If true, package executed without errors
        Dim PartListInDM(999, 2) As String ' expecting no more than a 1000 partitions.
        Dim DropPartCount As Integer = 0

        ' These objects capture execution results
        Dim oResults As Microsoft.AnalysisServices.XmlaResultCollection
        Dim oResult As Microsoft.AnalysisServices.XmlaResult
        Dim oMessage As Microsoft.AnalysisServices.XmlaMessage
        Dim dataBytes(0) As Byte

        ' These objects capture your partitions table
        Dim oOleDB As New OleDbDataAdapter
        Dim oTable As New DataTable
        Dim oRow As DataRow
        oOleDB.Fill(oTable, Dts.Variables("PartitionListInDW").Value)

        'Connect to SSAS database
        Dim oConnection As ConnectionManager
        oConnection = Dts.Connections("Cube")
        Dim sServer As String = CStr(oConnection.Properties("ServerName").GetValue(oConnection))
        Dim sDatabase As String = CStr(oConnection.Properties("InitialCatalog").GetValue(oConnection))
        Dim oServer As New Microsoft.AnalysisServices.Server
        oServer.Connect(sServer) ' connect to the server and start scanning down the object hierarchy
        Dim oDB As Microsoft.AnalysisServices.Database = oServer.Databases.FindByName(sDatabase)

        If oDB Is Nothing Then
            Dts.Log("Did not find expected database: " & sDatabase, 0, dataBytes) 'You need to setup custom  package logging to see this
            ExecutionSuccessfull = False
            GoTo Done
        End If

        'Cube attributes
        Dim oCube As Microsoft.AnalysisServices.Cube
        Dim oMeasureGroup As Microsoft.AnalysisServices.MeasureGroup
        Dim oPartition As Microsoft.AnalysisServices.Partition
        Dim bNeedToDropPartition As Boolean

        Dim strCube As String           'Cube - Cube Name
        Dim strMeasureGroup As String   'Cube - Measure Group
        Dim strPartition As String      'Cube - Partition
        Dim strRowCube As String        'Table - Cube Name
        Dim strRowMeasureGroup As String 'Table - Measure Group
        Dim strRowPartition As String   'Table - Partition
        Dim bMatch As Boolean           'String match

        'Iterate through each partition in the cube
        For Each oCube In oDB.Cubes
            strCube = oCube.Name
            For Each oMeasureGroup In oCube.MeasureGroups
                strMeasureGroup = oMeasureGroup.Name
                For Each oPartition In oMeasureGroup.Partitions
                    strPartition = oPartition.Name
                    bNeedToDropPartition = True
                    'Sets bMatch to True or False.  If Partition name like '%Current Open Period' then bMatch = True
                    bMatch = strPartition Like "*Current Open Period*"
                    'Iterate through each partition in the table and check if it exists in the cube already. 
                    For Each oRow In oTable.Rows
                        strRowCube = oRow("CubeName").ToString
                        strRowMeasureGroup = oRow("MeasureGroup").ToString
                        strRowPartition = oRow("Partition").ToString

                        'If the partition exists then don't drop it, except "Current Open Period" partitions
                        If strRowCube = strCube And strRowMeasureGroup = strMeasureGroup _
                        And strRowPartition = strPartition And bMatch = "False" Then
                            bNeedToDropPartition = False
                            Dts.Log("PARTITION FOUND - don't drop" & strRowPartition & "  Partition : " & strPartition, 0, dataBytes)
                            Exit For
                        End If

                    Next


                    'If the Partition does need to be dropped, then add the Partition details to the PartListInDM string object
                    If bNeedToDropPartition Then
                        PartListInDM(DropPartCount, 0) = oCube.Name
                        PartListInDM(DropPartCount, 1) = oMeasureGroup.Name
                        PartListInDM(DropPartCount, 2) = oPartition.Name
                        DropPartCount = DropPartCount + 1
                        Dts.Log("Found partition that needs to be dropped: " & oPartition.Name, 0, dataBytes) ' You need to setup package logging to see this
                    End If
                Next
            Next
        Next

        'Write the XML based on the PartListInDM string object to drop the Partitions
        '-------------------
        'START CAPTURING XML
        '-------------------
        oServer.CaptureXml() = True
        Dim i As Integer = 0
        For i = 0 To DropPartCount - 1
            oCube = oDB.Cubes.FindByName(PartListInDM(i, 0))
            oMeasureGroup = oCube.MeasureGroups.FindByName(PartListInDM(i, 1))
            oPartition = oMeasureGroup.Partitions.FindByName(PartListInDM(i, 2))
            oPartition.Drop()
        Next i
        oServer.CaptureXml() = False
        '-------------------
        'STOP CAPTURING XML
        '-------------------

        'Execute the log that contains the XMLA commands and drop the Partitions
        oResults = oServer.ExecuteCaptureLog(True, False) 'Execute within transaction=True, Execute in parallel=False

        'Log errors and warnings
        For Each oResult In oResults
            For Each oMessage In oResult.Messages
                If oMessage.GetType.Name = "XmlaError" Then
                    'Errors
                    Dts.Log(oMessage.Description, 0, dataBytes) 'You need to setup custom  package logging to see this
                    ExecutionSuccessfull = False 'Fail the Scrip Task
                Else
                    'Warnings
                    Dts.Log(oMessage.Description, 0, dataBytes) 'You need to setup custom  package logging to see this
                    ExecutionSuccessfull = True  'Don't fail the Scrip Task
                End If
            Next oMessage
        Next oResult
        ' -------------------------------------------------------------------------------------------------------------------------

Done:
        oServer.Disconnect()

        If ExecutionSuccessfull Then
            Dts.TaskResult = ScriptResults.Success
        Else
            Dts.TaskResult = ScriptResults.Failure
        End If


    End Sub

End Class
4c) Check if this is Full Reprocessing

This will check to see if the full cube will be reprocessed, or just some of the partitions.

image


image

SELECT CONVERT(bit, CASE WHEN PartCount = 0 THEN 1 ELSE 0 END) AS NeedsFullReprocessing
FROM (SELECT COUNT(*) AS PartCount FROM config.SSASPartitions WHERE NeedsReProcessing <> 1) B
4d) Process All Dims

This will always process all dimensions.

image

' Microsoft SQL Server Integration Services Script Task
' Write scripts using Microsoft Visual Basic 2008.
' The ScriptMain is the entry point class of the script.

Imports System
Imports System.Data
Imports System.Math
Imports Microsoft.SqlServer.Dts.Runtime
Imports Microsoft.AnalysisServices


<System.AddIn.AddIn("ScriptMain", Version:="1.0", Publisher:="", Description:="")> _
<System.CLSCompliantAttribute(False)> _
Partial Public Class ScriptMain
    Inherits Microsoft.SqlServer.Dts.Tasks.ScriptTask.VSTARTScriptObjectModelBase

    Enum ScriptResults
        Success = Microsoft.SqlServer.Dts.Runtime.DTSExecResult.Success
        Failure = Microsoft.SqlServer.Dts.Runtime.DTSExecResult.Failure
    End Enum
    

    ' The execution engine calls this method when the task executes.
    ' To access the object model, use the Dts property. Connections, variables, events,
    ' and logging features are available as members of the Dts property as shown in the following examples.
    '
    ' To reference a variable, call Dts.Variables("MyCaseSensitiveVariableName").Value
    ' To post a log entry, call Dts.Log("This is my log text", 999, Nothing)
    ' To fire an event, call Dts.Events.FireInformation(99, "test", "hit the help message", "", 0, True)
    '
    ' To use the connections collection use something like the following:
    ' ConnectionManager cm = Dts.Connections.Add("OLEDB")
    ' cm.ConnectionString = "Data Source=localhost;Initial Catalog=AdventureWorks;Provider=SQLNCLI10;Integrated Security=SSPI;Auto Translate=False;"
    '
    ' Before returning from this method, set the value of Dts.TaskResult to indicate success or failure.
    ' 
    ' To open Help, press F1.

    Public Sub Main()
        '
        Dim ExecutionSuccessfull As Boolean = True ' If true, package executed without errors
        Dim dataBytes(0) As Byte
        ' Dim sProcessType As String = "ProcessFull"

        Dim oConnection As ConnectionManager
        oConnection = Dts.Connections("Cube")
        Dim sServer As String = CStr(oConnection.Properties("ServerName").GetValue(oConnection))
        Dim sDatabaseID As String = CStr(oConnection.Properties("InitialCatalog").GetValue(oConnection))
        Dim oServer As New Microsoft.AnalysisServices.Server
        oServer.Connect(sServer) ' connect to the server and start scanning down the object hierarchy
        Dim oDB As Microsoft.AnalysisServices.Database = oServer.Databases.FindByName(sDatabaseID)

        Dim oThisIsFullReprocessing As Variable = Dts.Variables("ThisIsFullReprocessing") ' From variable
        Dim ThisIsFullReprocessing As Boolean = CType(oThisIsFullReprocessing.Value, Boolean)

        Dim ProcessType As Microsoft.AnalysisServices.ProcessType

        If ThisIsFullReprocessing Then
            ProcessType = Microsoft.AnalysisServices.ProcessType.ProcessFull
            Dts.Log("Will be doing FULL dimension processing", 0, dataBytes) ' You need to setup proper package loging to see this!
        Else
            ProcessType = Microsoft.AnalysisServices.ProcessType.ProcessUpdate
            Dts.Log("Will be doing UPDATE dimension processing", 0, dataBytes) ' You need to setup proper package loging to see this!
        End If

        If oDB Is Nothing Then
            ExecutionSuccessfull = False
            GoTo Done
        Else
            Dim oDim As Microsoft.AnalysisServices.Dimension

            oServer.CaptureXml() = True ' Start capturing XML. 
            For Each oDim In oDB.Dimensions
                ' This will generate XMLA, but because CaptureXML is True, will not execute it!
                If (oDim.MiningModel Is Nothing) Then
                    oDim.Process(ProcessType)
                End If

            Next
            oServer.CaptureXml() = False ' Stop capturing XML
            ' Execute captured XML. First parameter Transactional, second parameter Parallel, third optional parameter: processAffected 
            ' These are very important parameters!

            Dim oResults As Microsoft.AnalysisServices.XmlaResultCollection
            Dim oResult As Microsoft.AnalysisServices.XmlaResult

            oResults = oServer.ExecuteCaptureLog(True, True)
            'oResults = oServer.ExecuteCaptureLog(False, False)

            Dim oMessage As Microsoft.AnalysisServices.XmlaMessage

            Dim bt(0) As Byte
            'Log the errors and warnings
            For Each oResult In oResults
                For Each oMessage In oResult.Messages
                    If oMessage.GetType.Name = "XmlaError" Then
                        Dts.Log(oMessage.Description, 0, bt)

                        'The processing failed
                        ExecutionSuccessfull = False
                    Else
                        'It's just a warning. 
                        Dts.Log(oMessage.Description, 0, bt)
                        ExecutionSuccessfull = True ' if you want to fail on warning, change this to False
                    End If
                Next oMessage
            Next oResult

        End If
Done:
        oServer.Disconnect() ' disconnect from the server -- we are done

        If ExecutionSuccessfull Then
            Dts.TaskResult = ScriptResults.Success
        Else
            Dts.TaskResult = ScriptResults.Failure
        End If

        '
    End Sub

End Class

4e) Get DB Partitions List
 

image

image

SELECT CubeName,MeasureGroup, Partition, SQL, NeedsReProcessing 
FROM config.SSASPartitions 
ORDER BY 1,2,3
4f) Create Partitions that don’t exist in the cube

image

' Microsoft SQL Server Integration Services Script Task
' Write scripts using Microsoft Visual Basic 2008.
' The ScriptMain is the entry point class of the script.

Imports System
Imports System.Data
Imports System.Math
Imports System.Xml
Imports System.Data.OleDb
Imports Microsoft.SqlServer.Dts.Runtime
Imports Microsoft.AnalysisServices


<System.AddIn.AddIn("ScriptMain", Version:="1.0", Publisher:="", Description:="")> _
<System.CLSCompliantAttribute(False)> _
Partial Public Class ScriptMain
    Inherits Microsoft.SqlServer.Dts.Tasks.ScriptTask.VSTARTScriptObjectModelBase

    Enum ScriptResults
        Success = Microsoft.SqlServer.Dts.Runtime.DTSExecResult.Success
        Failure = Microsoft.SqlServer.Dts.Runtime.DTSExecResult.Failure
    End Enum
    

    ' The execution engine calls this method when the task executes.
    ' To access the object model, use the Dts property. Connections, variables, events,
    ' and logging features are available as members of the Dts property as shown in the following examples.
    '
    ' To reference a variable, call Dts.Variables("MyCaseSensitiveVariableName").Value
    ' To post a log entry, call Dts.Log("This is my log text", 999, Nothing)
    ' To fire an event, call Dts.Events.FireInformation(99, "test", "hit the help message", "", 0, True)
    '
    ' To use the connections collection use something like the following:
    ' ConnectionManager cm = Dts.Connections.Add("OLEDB")
    ' cm.ConnectionString = "Data Source=localhost;Initial Catalog=AdventureWorks;Provider=SQLNCLI10;Integrated Security=SSPI;Auto Translate=False;"
    '
    ' Before returning from this method, set the value of Dts.TaskResult to indicate success or failure.
    ' 
    ' To open Help, press F1.

    Public Sub Main()
        '------------------------------------------------------------------------
        'THIS SCRIPT TASK WILL CREATE ANY PARTITIONS IN THE LIST THAT DON'T EXIST
        '------------------------------------------------------------------------

        Dim ExecutionSuccessfull As Boolean = True ' If true, package executed without errors

        ' These objects capture execution results
        Dim oResults As Microsoft.AnalysisServices.XmlaResultCollection
        Dim oResult As Microsoft.AnalysisServices.XmlaResult
        Dim oMessage As Microsoft.AnalysisServices.XmlaMessage
        Dim dataBytes(0) As Byte

        ' These objects capture partitions table columns
        Dim oOleDB As New OleDbDataAdapter
        Dim oTable As New DataTable
        Dim oRow As DataRow
        oOleDB.Fill(oTable, Dts.Variables("PartitionListInDW").Value)

        'Connect to SSAS Database
        Dim oConnection As ConnectionManager
        oConnection = Dts.Connections("Cube")
        Dim sServer As String = CStr(oConnection.Properties("ServerName").GetValue(oConnection))
        Dim sDatabase As String = CStr(oConnection.Properties("InitialCatalog").GetValue(oConnection))
        Dim oServer As New Microsoft.AnalysisServices.Server
        oServer.Connect(sServer) ' connect to the server and start scanning down the object hierarchy
        Dim oDB As Microsoft.AnalysisServices.Database = oServer.Databases.FindByName(sDatabase)

        If oDB Is Nothing Then
            Dts.Log("Did not find expected database: " & sDatabase, 0, dataBytes) 'You need to setup custom package logging to see this
            ExecutionSuccessfull = False
            GoTo Done
        End If

        'Cube attributes
        Dim oCube As Microsoft.AnalysisServices.Cube
        Dim oMeasureGroup As Microsoft.AnalysisServices.MeasureGroup
        Dim oPartition As Microsoft.AnalysisServices.Partition
        Dim strRowCube As String
        Dim strRowMeasureGroup As String
        Dim strRowPartition As String

        '-------------------
        'START CAPTURING XML
        '-------------------
        oServer.CaptureXml() = True

        For Each oRow In oTable.Rows
            strRowCube = oRow("CubeName").ToString
            oCube = oDB.Cubes.FindByName(strRowCube)

            If oCube Is Nothing Then
                Dts.Log("Did not find cube: " & strRowCube, 0, dataBytes) 'You need to setup custom package logging to see this
                Continue For
            End If

            strRowMeasureGroup = oRow("MeasureGroup").ToString
            oMeasureGroup = oCube.MeasureGroups.FindByName(strRowMeasureGroup)

            If oMeasureGroup Is Nothing Then
                Dts.Log("Did not find measure group: " & strRowMeasureGroup, 0, dataBytes) 'You need to setup custom package logging to see this
                Continue For
            End If

            strRowPartition = oRow("Partition").ToString
            oPartition = oMeasureGroup.Partitions.FindByName(strRowPartition)

            'If the Partition doesn't exist in the cube, then capture create it
            If (oPartition Is Nothing) Then
                Dts.Log("Need to create partition: " & strRowPartition, 0, dataBytes) 'You need to setup custom package logging to see this
                oPartition = oMeasureGroup.Partitions.Add(strRowPartition)
                oPartition.StorageMode = StorageMode.Molap
                oPartition.Source = New QueryBinding(oDB.DataSources(0).ID, oRow("SQL").ToString)

                If oMeasureGroup.AggregationDesigns.Count > 0 Then ' 
                    oPartition.AggregationDesignID = oMeasureGroup.AggregationDesigns(0).ID ' Take first available aggregation design
                End If

                'Capture XML to add the Partition
                oPartition.Update(UpdateOptions.ExpandFull)
                Dts.Log("Partition created: " & strRowPartition, 0, dataBytes) 'You need to setup custom package logging to see this
            End If
        Next

        oServer.CaptureXml() = False
        '-------------------
        'STOP CAPTURING XML
        '-------------------


        'Execute the log that contains the XMLA commands and drop the Partitions
        oResults = oServer.ExecuteCaptureLog(True, False) 'Execute within transaction=True, Execute in parallel=False

        'Log the errors and warnings
        For Each oResult In oResults
            For Each oMessage In oResult.Messages
                If oMessage.GetType.Name = "XmlaError" Then
                    'Errors
                    Dts.Log(oMessage.Description, 0, dataBytes) 'You need to setup custom package logging to see this
                    ExecutionSuccessfull = False 'Fail the Script Task
                Else
                    'Warnings
                    Dts.Log(oMessage.Description, 0, dataBytes) 'You need to setup custom package logging to see this
                    ExecutionSuccessfull = True 'Don't fail the Script Task
                End If
            Next oMessage
        Next oResult
        ' -------------------------------------------------------------------------------------------------------------------------

Done:
        oServer.Disconnect()

        If ExecutionSuccessfull Then
            Dts.TaskResult = ScriptResults.Success
        Else
            Dts.TaskResult = ScriptResults.Failure
        End If


    End Sub

End Class
4g) Get DB Partitions List

image

image

SELECT CubeName,MeasureGroup, Partition, SQL, NeedsReProcessing 
FROM config.SSASPartitions 
ORDER BY 1,2,3
4h) Process Newly Created Partitions

image

' Microsoft SQL Server Integration Services Script Task
' Write scripts using Microsoft Visual Basic 2008.
' The ScriptMain is the entry point class of the script.

Imports System
Imports System.Data
Imports System.Math
Imports System.Xml
Imports System.Data.OleDb
Imports Microsoft.SqlServer.Dts.Runtime
Imports Microsoft.AnalysisServices


<System.AddIn.AddIn("ScriptMain", Version:="1.0", Publisher:="", Description:="")> _
<System.CLSCompliantAttribute(False)> _
Partial Public Class ScriptMain
    Inherits Microsoft.SqlServer.Dts.Tasks.ScriptTask.VSTARTScriptObjectModelBase

    Enum ScriptResults
        Success = Microsoft.SqlServer.Dts.Runtime.DTSExecResult.Success
        Failure = Microsoft.SqlServer.Dts.Runtime.DTSExecResult.Failure
    End Enum
    

    ' The execution engine calls this method when the task executes.
    ' To access the object model, use the Dts property. Connections, variables, events,
    ' and logging features are available as members of the Dts property as shown in the following examples.
    '
    ' To reference a variable, call Dts.Variables("MyCaseSensitiveVariableName").Value
    ' To post a log entry, call Dts.Log("This is my log text", 999, Nothing)
    ' To fire an event, call Dts.Events.FireInformation(99, "test", "hit the help message", "", 0, True)
    '
    ' To use the connections collection use something like the following:
    ' ConnectionManager cm = Dts.Connections.Add("OLEDB")
    ' cm.ConnectionString = "Data Source=localhost;Initial Catalog=AdventureWorks;Provider=SQLNCLI10;Integrated Security=SSPI;Auto Translate=False;"
    '
    ' Before returning from this method, set the value of Dts.TaskResult to indicate success or failure.
    ' 
    ' To open Help, press F1.

    Public Sub Main()
        '
        '------------------------------------------------------------------------
        'THIS SCRIPT TASK WILL PROCESS ANY NEWLY CREATED PARTITIONS IN THE LIST 
        '------------------------------------------------------------------------
        Dim ExecutionSuccessfull As Boolean = True ' If true, package executed without errors

        ' These objects capture execution results
        Dim oResults As Microsoft.AnalysisServices.XmlaResultCollection
        Dim oResult As Microsoft.AnalysisServices.XmlaResult
        Dim dataBytes(0) As Byte
        Dim oMessage As Microsoft.AnalysisServices.XmlaMessage

        ' These objects capture partitions table columns
        Dim oOleDB As New OleDbDataAdapter
        Dim oTable As New DataTable
        Dim oRow As DataRow
        oOleDB.Fill(oTable, Dts.Variables("PartitionListInDW").Value)

        'Connect to SSAS Database
        Dim oConnection As ConnectionManager
        oConnection = Dts.Connections("Cube")
        Dim sServer As String = CStr(oConnection.Properties("ServerName").GetValue(oConnection))
        Dim sDatabase As String = CStr(oConnection.Properties("InitialCatalog").GetValue(oConnection))
        Dim oServer As New Microsoft.AnalysisServices.Server
        oServer.Connect(sServer) ' connect to the server and start scanning down the object hierarchy
        Dim oDB As Microsoft.AnalysisServices.Database = oServer.Databases.FindByName(sDatabase)

        If oDB Is Nothing Then
            Dts.Log("Did not find expected database: " & sDatabase, 0, dataBytes) 'You need to setup custom package logging to see this
            ExecutionSuccessfull = False
            GoTo Done
        End If

        'Cube attributes
        Dim oCube As Microsoft.AnalysisServices.Cube
        Dim oMeasureGroup As Microsoft.AnalysisServices.MeasureGroup
        Dim oPartition As Microsoft.AnalysisServices.Partition


        '-------------------
        'START CAPTURING XML
        '-------------------
        oServer.CaptureXml() = True
        'For each row in the table

        For Each oRow In oTable.Rows
            If LCase(oRow("NeedsReProcessing").ToString) = LCase("False") Then
                Continue For
            End If

            'Find the cube
            oCube = oDB.Cubes.FindByName(oRow("CubeName").ToString)
            If oCube Is Nothing Then
                Dts.Log("Did not find cube: " & oRow("CubeName").ToString, 0, dataBytes) 'You need to setup custom package logging to see this
                Continue For
            End If

            'Find the MeasureGroup in the cube
            oMeasureGroup = oCube.MeasureGroups.FindByName(oRow("MeasureGroup").ToString)
            If oMeasureGroup Is Nothing Then
                Dts.Log("Did not find measure group: " & oRow("MeasureGroup").ToString, 0, dataBytes) 'You need to setup custom package logging to see this
                Continue For
            End If

            'Find the Partition in the Measure Group
            oPartition = oMeasureGroup.Partitions.FindByName(oRow("Partition").ToString)
            If (oPartition Is Nothing) Then
                Dts.Log("Partition does not exists: " & oRow("Partition").ToString, 0, dataBytes) 'You need to setup custom package logging to see this
                Continue For
            End If

            'Capture XML to Process the Partition
            oPartition.Process(Microsoft.AnalysisServices.ProcessType.ProcessFull)
        Next

        ' If the Measure Group is linked, then process the entire Measure Group
        For Each oCube In oDB.Cubes
            For Each oMeasureGroup In oCube.MeasureGroups
                If oMeasureGroup.IsLinked Then
                    oMeasureGroup.Process(Microsoft.AnalysisServices.ProcessType.ProcessDefault)
                End If
            Next
        Next

        oServer.CaptureXml() = False
        '-------------------
        'STOP CAPTURING XML
        '-------------------

        'Execute the log that contains the XMLA commands and drop the Partitions
        oResults = oServer.ExecuteCaptureLog(True, True) 'Execute within transaction=True, Execute in parallel=True

        'Log the errors and warnings
        For Each oResult In oResults
            For Each oMessage In oResult.Messages
                If oMessage.GetType.Name = "XmlaError" Then
                    'Errors
                    Dts.Log(oMessage.Description, 0, dataBytes) 'You need to setup custom package logging to see this
                    ExecutionSuccessfull = False 'Fail the Script Task
                Else
                    'Warnings
                    Dts.Log(oMessage.Description, 0, dataBytes) 'You need to setup custom package logging to see this
                    ExecutionSuccessfull = True 'Do not fail the Script Task
                End If
            Next oMessage
        Next oResult
        ' -------------------------------------------------------------------------------------------------------------------------

Done:
        oServer.Disconnect()

        If ExecutionSuccessfull Then
            Dts.TaskResult = ScriptResults.Success
        Else
            Dts.TaskResult = ScriptResults.Failure
        End If


    End Sub

End Class
4i) Update Process Status

Indicate that all the partitions have been processed.

UPDATE config.SSASPartitions 
SET NeedsReProcessing = 0
,LastProcessDate = GETDATE()
WHERE NeedsReProcessing = 1

Thanks again to Vidas Matelis.  His scripts, here, were invaluable.

Compare Week Last Year for a 53 Week Year Using MDX

Many companies use 4-4-5 calendar which ends up with an extra week approximately every 5 years.  This makes comparing periods challenging when you encounter the 53 week year.  This is especially challenging when reports are driven from an SSAS cube data source, and you want to build in the logic to automatically compare the correct This Year period with the corresponding Last Year period as per the companies business rules.  There is a way to do this.  It isn’t pretty, but it works.  The reporting will automatically choose the correct matching period in the context of a 52 or 53 week year.

There are some possibilities.  A company may want to compare the year after a 53 week year by shifting each week of the 53 week year by 1 week.  For example, if 2012 is the 53 week year then we want to compare:

image

Another possibility is that the company may want to compare the 53 week year by shifting the previous year weeks, or in some other way identify whether a week belongs to a 52 or a 53 week year for purposes of comparing periods.  This requires a bit more under the hood, but also doable. 

image

COMPARE THE YEAR AFTER A 53 WEEK YEAR WITH THE CORRESPONDING SHIFTED WEEKS FOR LAST YEAR

This is relatively easy.  Basically you make all your Last Year (LY) calculations and LY Period To Date calculations by counting back 52 weeks from the current week.  The week in your hierarchy must always be selected in your query.  I use Fiscal Week ID as the level to which I map all previous period calculations, so the Fiscal Week ID must be selected in all queries using these calculations.

This calculation will return the [Sls Dollars LY TW] (last year this week)

(PARALLELPERIOD
    ( [TIME].[Week Period To Date].[Fiscal Week ID], 52, [TIME].[Week Period To Date].CURRENTMEMBER  )
,[Measures].[Sales Dollars])

image

Notice how 2013 Wk 1 shows 2012 Wk 2 for the Sls Dollars LY TW.  And 2012 Wk 2 shows 2011 Wk 2 as desired.

For Periods To Date you can do this the same way.  You would like the LY QTD for 2013 Wk1 to show the QTD up to 2012 Wk 2.

This query returns [Sls Dollars LY QTD].

Aggregate
(
  PeriodsToDate
  (
            [TIME].[Week Period To Date].[Fiscal Quarter],

             PARALLELPERIOD
            ( [TIME].[Week Period To Date].[Fiscal Week ID],52,
                [TIME].[Week Period To Date].CURRENTMEMBER
            )
  ),
[Measures].[Sales Dollars]
)

Here are the results.  Again, you must have the Fiscal Week Id from the hierarchy selected in your query for this to work.

image

Notice how 2013 Wk 1 shows 2012 Wk 2 QTD for the Sls Dollars LY QTD. And 2012 Wk 2 shows 2011 Wk 2 QTD as desired.

IDENTIFY WHETHER A WEEK FALLS IN A 52 OR A 53 WEEK YEAR FOR USE IN CALCULATIONS

Here is an example of how to identify whether a week falls in a 52 or 53 week year, in order to be able to use in your calculations.  It isn’t pretty, but it does the job.

1.  Add a column to your DIM_Date table to identify whether a year has 52 or 53 weeks. 

image

2. Add a named calculation to the DIM_Date table in your cube Data Source View. 

image

The calculation is FiscalWeeksCount*10000+FiscalYearID. This will give you an integer which begins with either 52 or 53 and ends with the Year.  For example 522011 or 532012.

image

3. Add this calculated field to your Time dimension. Add it as a level of your Time Hierarchy, directly after Fiscal Year.  You may prefer to create a new hierarchy specifically for reporting needs so as not to confuse users. 

image

The reason the Year is appended to the Fiscal Weeks Count, rather than having the Fiscal Year roll directly up to Fiscal Weeks Count is that that would disturb the order of the children. 53 would come after 52 in the hierarchy, and therefor 2012 would come after 2013. The MDX calculations use relative position in the hierarchy to find a previous period, so the weeks must remain in the correct order in the hierarchy in order for this to work.

4. Save the change and rebuild the cube. Now you can reference this level in the hierarchy in order to identify how many weeks in the fiscal year.  You can use it in a case statement, like this:

CASE
WHEN [TIME].[Fiscal Weeks Count Year].CURRENTMEMBER.MEMBERVALUE > 530000 THEN
(PARALLELPERIOD ( [TIME].[Week Period To Date].[Fiscal Week ID], 53, [TIME].[Week Period To Date].CURRENTMEMBER ), [Measures].[Sales Dollars] )
ELSE
(PARALLELPERIOD ( [TIME].[Week Period To Date].[Fiscal Week ID], 52, [TIME].[Week Period To Date].CURRENTMEMBER ), [Measures].[Sales Dollars])
END

This determines if the current selected week falls in a 52 or a 53 week year, and calculated the corresponding previous period accordingly.  You could use ANCESTOR if you want to find out if the previous year was a 52 or a 53 week year.  You now know where your selected week is relative to a 53 week year and can use this information as needed.

Filter a Parameter with Long List of Values Using Type Ahead

I have a customer who has huge numbers of SKUs. Their reporting is using an SSAS cube as the data source. When filtering an SSRS report the users have to scroll through many many records to get to the SKU they want.   There is a type-ahead feature built into SSRS but you have to type superfast and hit it exactly in order to make it work.  I came across this great solution, and would like to blog the step-by-step with a cube as datasource. 

The solution is basically to add an additional text parameter which will prefilter the available values in the large parameter list.  This way the user doesn’t have to scroll through the long list to find the item they want, but can produce a shorter picklist, or even reduce the list down to one value if they type the exact SKU in.  They still have to check the box on the item they want, even if they’ve typed it all in, but it is still a good option when dealing with huge lists.

1. Alter your existing Available Values query to include the new pre-filter parameter.

When you created the original parameter in the report BIDS automatically created the dataset for the Available Values in the parameter.

image

You need to alter this query to use an additional pre-filter text based parameter.

1. Show hidden datasets.  Right click on your data source and select Show Hidden Datasets

image

2. Find out which dataset is being used by your parameter in the Available Values.  Right click on the parameter and select Parameter Properties.  Select the Available Values tab and find the name of the query being used.

image

3. Open up the dataset query.  Right click on the dataset you just identified, and select Query.

image

4. Add a parameter to the query.Click on the parameter button in Query Designer.

image

Type in the name of the new Parameter you would like to add for the type-ahead prefilter, and put in a Default value.  Don’t worry, you can change the default value in your Parameter Properties later if you wish.

image

Select OK.

5. Add the highlighted additional line of MDX to your query. Place the line right before the very last FROM [nameofcube], and add a close bracket at the end of the query.  This MDX will further filter your available values based on what is typed into the prefilter you are creating.

WITH MEMBER [Measures].[ParameterCaption] AS [Product].[Style Code].CURRENTMEMBER.MEMBER_CAPTION MEMBER [Measures].[ParameterValue]
AS [Product].[Style Code].CURRENTMEMBER.UNIQUENAME MEMBER [Measures].[ParameterLevel] AS [Product].[Style Code].CURRENTMEMBER.LEVEL.ORDINAL
SELECT {[Measures].[ParameterCaption], [Measures].[ParameterValue], [Measures].[ParameterLevel]} ON COLUMNS , [Product].[Style Code].ALLMEMBERS ON ROWS
FROM ( SELECT ( STRTOSET(@ProductDivisionCode, CONSTRAINED) ) ON COLUMNS
FROM ( SELECT (IIF(LEN(@ProductStyleCode_filter) =0, ([[Product].[Style Code].ALLMEMBERS), (FILTER([Product].[Style Code].ALLMEMBERS, INSTR ([Product].[Style Code].CURRENTMEMBER.MEMBER_CAPTION , @ProductStyleCode_filter) > 0)))) ON COLUMNS
FROM [Sales and Inventory])     )  

Click OK to save your Query.

BIDS has created your new paramater for you.  Now you can edit the default value of your parameter if you like, and then test your report. All should be working as expected.

Thanks to Thomas Puch and Ella Maschiach for their blogs on the subject.

How To Default SSRS Parameter to Current Month using an SSAS Data Source

When dealing with report parameters that involve time, I usually like to default the report to the current unit of time used by the report, often month.  When a user views the report in a particular month the parameter will always default to that month, saving the user from having to select it every time.

There are two elements to making this happen.  One is to define the current month in your Time dimension,  and the other is to build the dataset into your report to feed the default for the Time parameters.

1. Define current month in the SSAS Time dimension

I know there is Time functionality built into SSAS cubes, but I still like the flexibility of building attributes into my DIM_Date table in the data warehouse.  In this way it can be used in both cube and SQL queries alike.  I won’t go into details about how the Dim_Date table is created as that is another subject.  The DIM_Date table is rebuilt nightly and an attribute called MonthPeriod identifies whether the date is in Current Month, Previous Month, etc.  You can label any months you like, with your own descriptions.  Some examples are below.

image

The important thing about this attribute is to ensure that MonthPeriodID for the current month is always 0, and the MonthPeriodID for other months is relative to that. So ‘Current Month –1’ is 1, ‘Current Month –2’ will be 2, etc. This way you can build logic into your reports which relies on the fact that, for example, last month has a MonthPeriodID of 1.  It is critically important that the underlying ids belonging to each description are always the same.  If Current Month is 0 today and changes to 10 tomorrow, the defaults in your reports will not work.  SSRS stores the MDX tuple associated with the description and not the actual description. So when you select ‘Current Month’ in step 3 below, SSRS is storing [TIME].[Month Period].&[0] and not the ‘Current Month’ label.

Once you have this attribute defined in your DIM_Date table and it is being updated nightly, add it to the SSAS cube for use in your reports.

2. Build the default dataset into your report to feed the SSRS Parameter.

Background:

When you build the main dataset for the report and add parameters in your dataset,

image

SSRS automatically creates the dataset for the Available Values for the parameter. You can view these hidden datasets used to feed Available Values by right clicking on [Datasets] in the [Report Data] window in SSRS and selecting [Show Hidden Datasets]. 

image

You can view and/or edit any of these hidden datasets.

image

I don’t recommend editing the hidden datasets, since they are created and used by SSRS by default and your changes can sometimes be overwritten if you add additional datasets using the same parameters.  If you wish to customize the Available Values you are better off creating a new dataset with a different name specific to that purpose and then changing Report Parameter Properties to use the new dataset to retrieve the Available Values.

image

Building the Default Dataset

For this particular report the user can choose Year and then Month Of Year.  The same dataset can be used to feed both the default current year and the current month. 

1. Right click on Datasets in the Report Data window and select Add Dataset.

2. Select the Radio Button ‘Use a dataset embedded in my report’.  I like to use Shared Datasets for this type of thing, but for some reason shared datasets used for defaults with an SSAS data source don’t seem to work when published to SharePoint.  So for now just embed it in the report.  Select (or define) the cube you are using as your Data source, and click on the Query Designer button.

image

3. From the TIME dimension drag the ‘Month Period’ attribute defined in Part 1 to the filter area of the Query Designer.  Click in the Filter Expression and select ‘Current Month’. Click OK.

image

4.  Drag Year and Month of Year onto the Query design page.  Right click on the design page and select ‘Include Empty Cells’ so the current attributes will appear when the query is executed.

image

5. Right click in the Calculated Members area and select ‘New Calculated Member’.  From the Metadata pane drag the Year attribute from the TIME dimension into the Expression pane.  Add to the end of the expression “.CurrentMember.UniqueName”.  Give the Calculated Member a name of ‘YearValue’.  Click OK.

image

6. Right click on the new calculated member called YearValue and select Add to Query.

image

7.  Add another calculated member following steps 5 & 6 called MonthOfYearValue. 


image

8. Your dataset now contains the Label and the underlying MDX tuple needed to feed the default time values to your report parameter.

image

9. Click OK to close out of the Query Designer.  Give the dataset a name of DefaultYearMonth. Click OK to save the dataset.

10. Double click the TIMEYear parameter in the Paramaters folder of the Report Data window to edit the Report Parameter Properties. Select the Default Values option. Choose the ‘Get values from a query’ radio button.  In the dataset drop down choose the DefaultYearMonth dataset you created.  In the Value field dropdown select YearValue.

image

11. Do the same as Step 10 for the TIMEMonthOfYear parameter.  Select DefaultYearMonth as the dataset, and MonthOfYearValue for the Value field.

When you preview your report, the parameters will now default to the current year and month.  Going forward the default for the parameter will roll over to whichever month is current.  Users appreciate not having to choose the current month every time they look at a report.

image

How to Create an Inventory Aging Report from a Cube Data source

This is the fourth in a series of blogs about how to use math to filter out values from an SSAS dataset, and then create aggregations in a report.  You want to filter out some values from a report column and then sum them, but you can’t use an IIF statement because it can’t be aggregated.  Related blogs : Filter Most-Recent-Day, Week-To-Date and Full WeekFilter from Percentage where Last Year = Zero, and Aggregate Last Child   

In this situation the client would like an Inventory Aging report.  The report needs to include columns for inventory received 0-3 months, 4-6 months, 7-9 months and 10-12 months ago.  The user can choose a Fiscal Week for the On Hand Inventory, and the report must calculate the aging based on the Last Receipt Date, which is built into the Inventory On Hand table.  This seems simple enough until you get into the details. 

The end results should look like this:

image

1.  CUBE MUST HAVE TWO DIFFERENT TIME DIMENSIONS

The user must be able to select the week of the On Hand Inventory, and the report must render the aging based on Receipt Date.  So two different date fields are required in your Inventory FACT table – Inventory Date and Receipt Date, and two different time dimensions should be created from these. 

2. CUBE DIMENSION NEEDS TWO WAYS TO ACCESS FISCAL MONTH ID
 

The next thing you need is a dataset with the right fields in it to allow you calculate the aging.  You’ll need the Fiscal Month ID of the selected Inventory Date as well as the Fiscal Month ID of the Receipt Dates, so you can calculate how many months apart they are for the aging.  Unfortunately you can’t include two fields in your dataset with the same name, which is what would happen if I just pulled in each of the Fiscal_Month_ID fields from the two Time dimensions. 

If I try to build a calculated field in order to rename one of the fields I still need something from the Time dimension that will populate the CURRENTMEMBER aspect.  So if I built a calculated field like this [TIME OH Last Receipt Date].[Fiscal Month].CURRENTMEMBER.UNIQUENAME, it will return [TIME OH Last Receipt Date].[Fiscal Month].[All] unless I pull in the Fiscal Month ID field to give the CURRENTMEMBER it’s context.  This will mean two fields with the same name again, and the query will not accept it.

I worked around this by including Fiscal_Month_ID AND Fiscal_Month in my Time dimensions, with Fiscal_Month using the Fiscal_Month_ID as it’s key.  This gives me two ways to access the Fiscal Month ID, one from each Time dimension.

3. REPORT DATASET NEED CORRECT FIELDS TO YIELD DESIRED RESULTS

In the Dataset Query I included Fiscal_Month_ID from the OH Inventory Time dimension and Fiscal_Month from the Last Receipt Date Time dimension.  Then I added a calculated field called ReceiptMonth to my query which yields the tuple showing the underlying Fiscal Month ID.

[TIME OH Last Receipt Date].[Fiscal Month].CURRENTMEMBER.UNIQUENAME

I will reference this field to find the number of months difference between the user Selected Month and the Last Receipt Date.

4. ADD CACULATED FIELDS

image

Right click on your Dataset and select Dataset Properties.  Go to the Fields selection and add the following calculated fields:

1.  ReceiptMonthID – This pulls the Month ID out of the tuple.  My month IDs are in the form of 201001 for example for January 2010.

=Mid(Fields!RecepitMonth.Value,InStr(Fields!RecepitMonth.Value,"].&[")+4,6)

2. MonthDiff – Because the Month IDs are in the form of 201001, they need to be turned into dates to calculate the number of months between them.  The +1 will prevent division by zero in the next calculations.

=DateDiff("M",
CDate(RIGHT(Fields!ReceiptMonthID.Value,2)+"-01-"+LEFT(Fields!ReceiptMonthID.Value,4)),
CDate(RIGHT(Fields!Fiscal_Month_ID.Value,2)+"-01-"+LEFT(Fields!Fiscal_Month_ID.Value,4)))+1

3. ThreeMonths – This actually included 4 months, the current month plus the previous 3 months.  It returns a 1 if the MonthDiff between 1 and 4, otherwise it returns a 0.

=CEILING(FLOOR(4/Fields!MonthDiff.Value)/(4/Fields!MonthDiff.Value))*Fields!Inv_Dollars.Value

I take the Floor of 4/MonthDiff to get a positive value if the MonthDiff <= 4.  Then I divide it by (4/MonthDiff) to get a value of between 0 and 1.  And I take the Ceiling of this to end up with either a 1 or a zero.

4. SixMonths – This includes the current month plus the previous 6 months.  It returns a 1 if the MonthDiff between 1 and 6, otherwise it returns a 0.

=CEILING(FLOOR(7/Fields!MonthDiff.Value)/(7/Fields!MonthDiff.Value))*Fields!Inv_Dollars.Value

5. NineMonths – This includes the current month plus the previous 9 months. It returns a 1 if the MonthDiff between 1 and 9, otherwise it returns a 0.

=CEILING(FLOOR(10/Fields!MonthDiff.Value)/(10/Fields!MonthDiff.Value))*Fields!Inv_Dollars.Value

6. TwelveMonths – This includes the current month plus the previous 12 months. It returns a 1 if the MonthDiff between 1 and 12, otherwise it returns a 0.

=CEILING(FLOOR(13/Fields!MonthDiff.Value)/(13/Fields!MonthDiff.Value))*Fields!Inv_Dollars.Value

5. ADD A DATASET FILTER TO REMOVE FUTURE MONTHS

Right click on the Dataset and go to the Filters tab. Add this filter.  Be sure to select the data type of Integer or you will get an error.

image

6.  DO A BIT OF MATH IN THE REPORT TO USE THE CALCULATED FIELDS

0 –3 MONTHS =Sum(Fields!ThreeMonths.Value)

4 – 6 MONTHS =SUM(Fields!SixMonths.Value)-SUM(Fields!ThreeMonths.Value)

7 – 9 MONTHS =SUM(Fields!NineMonths.Value)-SUM(Fields!SixMonths.Value)

10 – 12 MONTHS =SUM(Fields!TwevleMonths.Value)-SUM(Fields!NineMonths.Value)

OLDER THAN 12 MONTHS =SUM(Fields!Inv_Dollars.Value)-SUM(Fields!TwevleMonths.Value)

This is just junk data, but you can get the idea of how the report slots the inventory into the right aging based on the MonthDiff.

image

Now hide the details to show the correct aggregates for your report.

image

This is not as complex as some situations, but it’s nice to be able to filter out values from your query and aggregate the results without having to use custom code for to do the aggregation for every value that has an Iif statement.  I find this much cleaner, once you get the math right.

How to build a Weekly Report with Most-Recent-Day and Week-To-Date values Filtered correctly for Last Year

Not to beat a dead horse, but this is another SSRS aggregation situation against a cube data source that can be solved by math.  This is the third in a series, and I suspect there will be a few more, since each situation is different. 

You can get the concept from my previous posts Filter Zeros from a Percent Increase and Aggregating Last Child values.  This one is even more complicated, but I’ll give the quick and dirty version.

The client wants a report that allows the user to choose a week, and have report columns for the most recent day in that week (so it will be Saturday for all past weeks, and today for the current week), for the week-to-date, and for the full week.  This get tricky because some of the values in these sets of columns include most recent day Last Year, and week-to-date Last Year.  I can’t filter the data set because some of the columns need the full week values for Budget and for Last Year, even if we’re only part way through the week.  Below is a report with the weekdays toggled open so you can see exactly how the values are summing up for the groups.  Thursday is the most recent day in the week, so it is the only one included in the Thursday totals.  Sunday to Thursday are included in the Week-To-Date totals. 

image

To accomplish this I use math to zero out any unwanted values.  The math itself takes some thinking, and every situation is different. I put the values in a spreadsheet and play with them until I get the right combination.  Here is how I solved this one.

CREATE TWO FACTORS – Week-To-Date and Most Recent Day

The end goal is to create two multipliers, one for Most Recent Day, and one for Week To Date.  You will be able to use these multipliers on any measure in your data set to filter out unwanted values.  

The user can select a single week for the report.  The report dataset must contain the integer value of the Week Number out of the parameter select by the user.  **Note: this solution only works if the weeks in your cube are numbered uniquely and consecutively over time.  So the first week in your Date table should be week one (or whatever starting point you choose), and each week number thereafter should be greater than the last.

image

1. CREATE NEW FIELDS IN THE REPORT DATASET PROPERTIES

Double click on your dataset and go to the Fields tab in the Dataset Properties.  Click on the Add button and select Calculated Field.

image


2. FIRST WE FIND THE MAXIMUM DAY FOR THE SELECTED WEEK

Add the following Calculated Fields. The end goal is to create two multipliers, one for Most Recent Day, and one for Week To Date.  You will be able to use these multipliers on any measure in your data set to filter out unwanted values.  See Excel screenshot below for examples broken down for current week and previous week.

1. NowDay  – This gives me the day number of today from 1 to 7

=DatePart("w",Now(),FirstDayOfWeek.Sunday)

2. CurrentWk  – There is a hidden parameter  in the report defaulting to whatever the week number is of today.  Example today could fall in week # 319 according to my DIM_Time table. **

=Replace(Mid(Parameters!CurrentWeekID.Value,InStr(Parameters!CurrentWeekID.Value,"].&[")+4,10),"]","")

3. Floor  – The floor returns either a 1 or a 0.  It returns a 1 if the week selected is the current week, otherwise it returns 0. 

=FLOOR ( Fields!Fiscal_Week_ID.Value/Fields!CurrentWk.Value )

4. Ceiling – The ceiling returns either a 7 or a 0.  It returns a 0 if the week selected is the current week, otherwise it returns a 7.  I use a +1 to prevent a divide by zero.

=(CEILING( (Fields!CurrentWk.Value-Fields!Fiscal_Week_ID.Value) / (ABS(Fields!CurrentWk.Value-Fields!Fiscal_Week_ID.Value)+1) ))*7

5. MaxDayTW –This is the maximum day number (1 to 7) for the week selected.  If it is the current week it will be whatever number day of the week today is.  If is a past week it will return a 7.  So if today is Wednesday, and my week starts on Sunday, then MaxDayTW will be 4. The way it works is if the current week is selected then the Ceiling will be zero, and we will keep the  NowDay value.  If it is a past week, then the NowDay value will be zero’d out and the Ceiling will be 7, making it the MaxDayTW = 7, the last day of the week.

=(Fields!NowDay.Value*Fields!Floor.Value) + Fields!Ceiling.Value

6. MaxDayTW_Name – This gives the weekday name for the MaxDayTW that we calculated – Monday, Tuesday, etc. to be used in the column header of the report.

=WeekdayName(Fields!MaxDayTW.Value)

3. THEN WE CREATE THE MULTIPLIERS

Add the following calculated fields:

7. WeekToDate_multiplier – This will return a 1 or a 0.  It will be a 1 for all days which are less than or equal to the MaxDayTW, and zero out any unwanted days in the week-to-date.

=CEILING  (  FLOOR ( Fields!MaxDayTW.Value / Fields!Day_Of_Week_ID.Value ) / ( Fields!MaxDayTW.Value / Fields!Day_Of_Week_ID.Value )  )

8. MostRecentDay_multiplier – This will return a 1 or a 0.  It will be 1 for the most recent day of the week and a 0 for any other days of the week.

=FLOOR (Fields!Day_Of_Week_ID.Value /Fields!MaxDayTW.Value)*Fields!WeekToDate_multiplier.Value

image

image

image

4. USE THE MULTIPLIERS IN YOUR REPORT

You can either create additional calculated fields in your dataset, or you can just apply the multipliers directly in your report.  I prefer to use them in the report so I don’t have to track back to multiple places to find out exactly how a calculation is working.  Be sure to use the multiplier BEFORE aggregating, since you want to multiply the individual rows, not the aggregate.

Examples:

1. To get Most Recent Day Sales $ use this calculation:

=Sum(Fields!Sales_Dollars.Value*Fields!MostRecentDay_multiplier.Value

2. To get Week To Date Sales $ for Last Year use this calculation:

=Sum(Fields!Sls_Dollars_LY.Value*Fields!WeekToDate_multiplier.Value)

Here are the results. The weekdays are toggled open so you can see exactly how the values are summing up for the groups.  Thursday is the most recent day in the week, so it is the only one included in the Thursday totals.  Sunday to Thursday are included in the Week-To-Date totals.

image

This is not a simple solution, but once it is in place it is very simple to use.  It gets around all the complexities of having to use Custom Code to sum up each different measure for each different group in your report.  It also allows you to have repeating headers on each page rather than having to hold your table within a List to make the Custom Code work properly in all renderings.  Get the two multipliers right, and you can aggregate as many measures as you like without any hassle at all.

** It’s worth repeating that this solution only works if the weeks in your cube are numbered uniquely and consecutively over time.  So the first week in your Date table should be week one (or whatever starting point you choose), and each week number thereafter should be greater than the last.

How to Filter out Last Year Value from a Percent Increase aggregation when the Last Year value is less than or equal to Zero

This is a sister solution to my last post which describes how to use math to ignore unwanted values in a cube query for an SSRS report, but still be able to aggregate the resulting values.  IIF statements can’t be aggregated, and aggregations can’t be nested, but math can always be aggregated in SSRS.

A common requirement is to calculate a Percent Increase over Last Year (LY).  The Percent Increase calculation is:

=(This Year – Last Year) / Last Year

But what if you want to ignore all values in a row where LY <= 0?  You can hide the detail rows using an IIF statement in your report, but to sum and calculate the percentage at a group level all values will be summed.  If this Year (TY) is more than zero it will be included in the % calculation, even though LY was less than or equal to zero.  And if LY is less than zero it will also be included in the sum.  This will skew the results and not give the desired results.  For example:

image

image

The basic premise is that you want to zero out LY and TY in your calculation if LY <= 0.  Here’s how.

1. ADD A CALCULATED FIELD TO YOUR DATASET

Add a calculated field to your Dataset Query called “LY_Inc_Multiple”.  Right click on the report Dataset, select Dataset Properties, Select Fields, click on the Add button and select Calculated Field.

2. WRITE YOUR CALCULATION

We want to create a calculation that will produce either a 1 if LY is positive or a 0 if LY is zero or negative.  We can then use this to multiply the values in the aggregate percent calculation for the Group to exclude any unwanted values from the result. Here I will divide LY by the absolute value of itself, plus one. The ‘plus one’ is to prevent division by zero if LY is zero. Take the Ceiling of this calculation will give you a result of either 1 or 0.  

Click on the function button in the Field Source of your new LY_Inc_Multiple calculation.  Enter the following:

=(Ceiling(Fields!LY.Value/(ABS(Fields!LY.Value)+1)))

Here is how the calculation works, broken down step by step

image

3. USE YOUR CALCULATION IN THE REPORT

You can then go ahead and multiply your Increase Percent variables to zero out any unwanted values.  Be sure to use the LY_Inc_Multiple in your statement BEFORE summing.

For clarity, your calculation is this:

=(LY_Inc_Multiple*(TY-LY))/(LY_Inc_Multiple*LY)

In your report at the group level it manifests as this :

=Iif(Sum(Fields!LY_Inc_Multiple.Value*Fields!LY.Value)=0,"",((SUM(Fields!LY_Inc_Multiple.Value*(Fields!TY.Value-Fields!LY.Value))/Sum(Fields!LY_Inc_Multiple.Value*Fields!SunLY.Value))))

The IIF statement will hide any division by zero.

That’s basically it.  Each situation you come across will be slightly different, and you’ll need to think about the math you need for your particular situation.  It’s brain teaser for sure, but once you get the hang of it it can make report building much simpler.  You can avoid custom code solutions which have their own headaches, and you can control your summing and grouping without any funkiness.

SSRS – Aggregate LAST YTD or LAST CHILD Value in an SSAS query

Trying to aggregate an aggregate is not possible in SSRS.  You can write custom code to capture the running total of values in a report, which works, but can have unexpected behaviour when groups in your report change. It also prevents you from using some other SSRS functionality, for example repeating column headers on a page.

Here is an example of a solution that works using math, which doesn’t prohibit you from using any functionality, since SSRS has no trouble aggregating math equations.  This solution has many applications in filtering out unwanted values in a row.  I will show you an example where only the most recent (LAST) value of YTD is wanted for each group of rows in a query.

1.  In my cube, the YTD calculation requires a member of the “Week Period To Date” hierarchy to be selected.

Aggregate
(
  PeriodsToDate
  (
     [TIME].[Week Period To Date].[Fiscal Year],
     [TIME].[Week Period To Date].CurrentMember
  ),
[Measures].[Sales Dollars]
)

2. In my report, the user can select a range of weeks.  So I include the Week ID from the “Week Period To Date” hierarchy in the query in order to return results for YTD.  Notice that the YTD Sales grow incrementally each week. 

image

I can sum the Sales Units in the report, and my report Groups will capture the correct value when using Sum.  But to aggregate YTD across groups I want to capture only the LAST value.  In my detail I can select the last value for the detail group, but now I want to SUM these LAST values for the parent group.  SSRS gives an error when specifying SUM (LAST(Sls Un YTD)).  IIF statements can’t be aggregated either, not even from a calculated field in the query.

3.  The solution is so simple, it only took me 3 days to figure out.

First, I built the query against the cube as above, including the weeks and the YTD field from the cube.  Then I added a Calculated Field to the Dataset.  Right click on the report Dataset, select Dataset Properties, Select Fields, click on the Add button and select Calculated Field.

image

4. I added a calculated field for the last week in the range selected by the user.  The calc pulls the integer value of the Week Number out of the parameter select by the user.  ***Note: this only works if the weeks in your cube are numbered uniquely and consecutively over time.  So the first week in your Date table should be week one (or whatever starting point you choose), and each week number thereafter should be greater than the last.

=Replace(Mid(Parameters!ToTIMEFiscalWeekIDName.Value,InStr(Parameters!ToTIMEFiscalWeekIDName.Value,”].&[“)+4,10),”]”,””)

5.  Now the magic.  I added a calculated field called Sls_Un_YTD_calc.  I always name my calculations whatever the altered measure name is plus “_calc”.  This makes it very easy to use/replace in fields and calculations in the report.  Here is the calculation.

=Floor(Fields!Fiscal_Week_ID.Value/Fields!ToWeek.Value)*Fields!Sls_Un_YTD.Value

Simple, right?  This basically says, whatever week you are looking at, if it’s the last week in the selected range then muliply the YTD by One otherwise multiply it by Zero.  By dividing the week in the row, but the maximum week in the range, you will either get One for the last week, or less than one for any other week.  Taking the Floor of this value makes anything less than one into zero.  Ta da!  You have successfully zeroed out any unwanted values from your dataset, and in your report you can sum away to your hearts content.

SSAS Many-to-Many Dimension Attribute: Single Letter Grade

Did you ever wish you could skip the many-to-many relationship hassle and just convert the text attribute to a measure? Well, if the attribute is a single letter, the answer is you can.

A client wanted a Grade captured for a cross between two dimensions, Product and Location.  They have a Grade for each combination of Store plus Department, where Department is an attribute of the Product dimension.  I started out by adding a dimension to the cube called Store Dept, and then a hidden measure group that only had the count in it, so that I could create the many-to-many relationship in the Dimension Usage tab.  This worked, but performance was very slow in retrieving the letter grade from the Store Dept dimension for the combination of Store Dept.  

I wondered how I could make this text attribute into a measure, since that’s really what is was.  SSAS will not allow text as a measure.  My first thought was to make A = 1, B= 2, etc feed it into the cube as a measure and then decode it on the report side.  But this is clunky since I’d have to decode every possibility  of 26 letters both on the way in and on the way out.  There has to be a much cleaner way to do this – and there is!

Convert the Letter Grade into it’s ASCII character value

1. Create the table as a FACT table containing the Location Code, Department Code, Store Dept Grade, and convert the letter grade into it’s ASCII integer value.

SELECT
Location_Code,
Department_Code,
Store_Dept_Grade,
ASCII(Store_Dept_Grade) as Store_Dept_Grade_ASCII  FROM tablename


image

2. Add the table to your cube data source view, connecting Location Code and Department Code to the appropriate tables.

image

3. Add a new Measure Group based on the FACT_Store_Dept_Grade table, and add the measure “Store Dept Grade ASCII”.  I like to keep ‘ASCII’ in the description so report builders will remember to convert it to a letter.  Set the AggregationFunction in the measure Properties window to “Min”. 

image

4.  Rerun the cube and go to the browser tab.  When you select Location Code and Department Code you will get the correct ASCII value of the Store Dept Grade.

5. Build your report query including the Store Dept Grade ASCII measure.  In your report right click on the textbox in which you would like to place the Store Dept Grade.  Enter the following Expression. The IsNothing bit will keep you from getting ‘NaN’ if it is null.

=Iif(ISNOTHING(Fields!Store_Dept_Grade_ASCII.Value)=TRUE,"",Chr(Fields!Store_Dept_Grade_ASCII.Value))

6.  Review your report.  The ASCII value of the Grade has been converted back to the correct letter.

image

This is a very clean workaround to making a text value into a measure for use in reports. No funky hard-coding on the front end or the back end.  Just interpret the letter as an integer into the cube and then interpret it as a letter on the report side.  You could even add a time dimension, if this is useful in your scenario.  You could aggregate as Last Child.  This wasn’t needed in this particular scenario, but this is a good starting point for other similar situations.