How to Create an Inventory Aging Report from a Cube Data source

This is the fourth in a series of blogs about how to use math to filter out values from an SSAS dataset, and then create aggregations in a report.  You want to filter out some values from a report column and then sum them, but you can’t use an IIF statement because it can’t be aggregated.  Related blogs : Filter Most-Recent-Day, Week-To-Date and Full WeekFilter from Percentage where Last Year = Zero, and Aggregate Last Child   

In this situation the client would like an Inventory Aging report.  The report needs to include columns for inventory received 0-3 months, 4-6 months, 7-9 months and 10-12 months ago.  The user can choose a Fiscal Week for the On Hand Inventory, and the report must calculate the aging based on the Last Receipt Date, which is built into the Inventory On Hand table.  This seems simple enough until you get into the details. 

The end results should look like this:

image

1.  CUBE MUST HAVE TWO DIFFERENT TIME DIMENSIONS

The user must be able to select the week of the On Hand Inventory, and the report must render the aging based on Receipt Date.  So two different date fields are required in your Inventory FACT table – Inventory Date and Receipt Date, and two different time dimensions should be created from these. 

2. CUBE DIMENSION NEEDS TWO WAYS TO ACCESS FISCAL MONTH ID
 

The next thing you need is a dataset with the right fields in it to allow you calculate the aging.  You’ll need the Fiscal Month ID of the selected Inventory Date as well as the Fiscal Month ID of the Receipt Dates, so you can calculate how many months apart they are for the aging.  Unfortunately you can’t include two fields in your dataset with the same name, which is what would happen if I just pulled in each of the Fiscal_Month_ID fields from the two Time dimensions. 

If I try to build a calculated field in order to rename one of the fields I still need something from the Time dimension that will populate the CURRENTMEMBER aspect.  So if I built a calculated field like this [TIME OH Last Receipt Date].[Fiscal Month].CURRENTMEMBER.UNIQUENAME, it will return [TIME OH Last Receipt Date].[Fiscal Month].[All] unless I pull in the Fiscal Month ID field to give the CURRENTMEMBER it’s context.  This will mean two fields with the same name again, and the query will not accept it.

I worked around this by including Fiscal_Month_ID AND Fiscal_Month in my Time dimensions, with Fiscal_Month using the Fiscal_Month_ID as it’s key.  This gives me two ways to access the Fiscal Month ID, one from each Time dimension.

3. REPORT DATASET NEED CORRECT FIELDS TO YIELD DESIRED RESULTS

In the Dataset Query I included Fiscal_Month_ID from the OH Inventory Time dimension and Fiscal_Month from the Last Receipt Date Time dimension.  Then I added a calculated field called ReceiptMonth to my query which yields the tuple showing the underlying Fiscal Month ID.

[TIME OH Last Receipt Date].[Fiscal Month].CURRENTMEMBER.UNIQUENAME

I will reference this field to find the number of months difference between the user Selected Month and the Last Receipt Date.

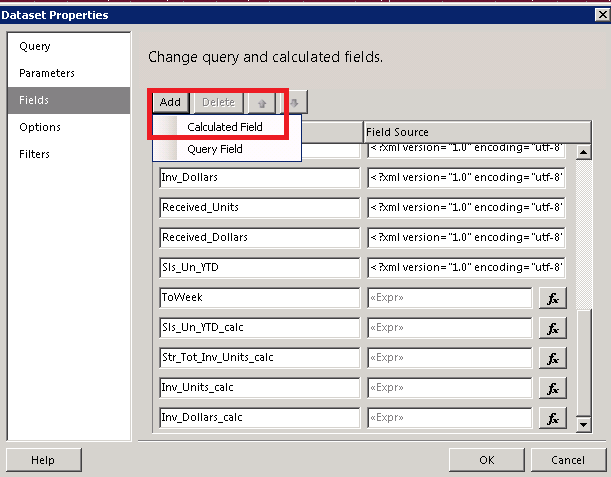
4. ADD CACULATED FIELDS

image

Right click on your Dataset and select Dataset Properties.  Go to the Fields selection and add the following calculated fields:

1.  ReceiptMonthID – This pulls the Month ID out of the tuple.  My month IDs are in the form of 201001 for example for January 2010.

=Mid(Fields!RecepitMonth.Value,InStr(Fields!RecepitMonth.Value,"].&[")+4,6)

2. MonthDiff – Because the Month IDs are in the form of 201001, they need to be turned into dates to calculate the number of months between them.  The +1 will prevent division by zero in the next calculations.

=DateDiff("M",
CDate(RIGHT(Fields!ReceiptMonthID.Value,2)+"-01-"+LEFT(Fields!ReceiptMonthID.Value,4)),
CDate(RIGHT(Fields!Fiscal_Month_ID.Value,2)+"-01-"+LEFT(Fields!Fiscal_Month_ID.Value,4)))+1

3. ThreeMonths – This actually included 4 months, the current month plus the previous 3 months.  It returns a 1 if the MonthDiff between 1 and 4, otherwise it returns a 0.

=CEILING(FLOOR(4/Fields!MonthDiff.Value)/(4/Fields!MonthDiff.Value))*Fields!Inv_Dollars.Value

I take the Floor of 4/MonthDiff to get a positive value if the MonthDiff <= 4.  Then I divide it by (4/MonthDiff) to get a value of between 0 and 1.  And I take the Ceiling of this to end up with either a 1 or a zero.

4. SixMonths – This includes the current month plus the previous 6 months.  It returns a 1 if the MonthDiff between 1 and 6, otherwise it returns a 0.

=CEILING(FLOOR(7/Fields!MonthDiff.Value)/(7/Fields!MonthDiff.Value))*Fields!Inv_Dollars.Value

5. NineMonths – This includes the current month plus the previous 9 months. It returns a 1 if the MonthDiff between 1 and 9, otherwise it returns a 0.

=CEILING(FLOOR(10/Fields!MonthDiff.Value)/(10/Fields!MonthDiff.Value))*Fields!Inv_Dollars.Value

6. TwelveMonths – This includes the current month plus the previous 12 months. It returns a 1 if the MonthDiff between 1 and 12, otherwise it returns a 0.

=CEILING(FLOOR(13/Fields!MonthDiff.Value)/(13/Fields!MonthDiff.Value))*Fields!Inv_Dollars.Value

5. ADD A DATASET FILTER TO REMOVE FUTURE MONTHS

Right click on the Dataset and go to the Filters tab. Add this filter.  Be sure to select the data type of Integer or you will get an error.

image

6.  DO A BIT OF MATH IN THE REPORT TO USE THE CALCULATED FIELDS

0 –3 MONTHS =Sum(Fields!ThreeMonths.Value)

4 – 6 MONTHS =SUM(Fields!SixMonths.Value)-SUM(Fields!ThreeMonths.Value)

7 – 9 MONTHS =SUM(Fields!NineMonths.Value)-SUM(Fields!SixMonths.Value)

10 – 12 MONTHS =SUM(Fields!TwevleMonths.Value)-SUM(Fields!NineMonths.Value)

OLDER THAN 12 MONTHS =SUM(Fields!Inv_Dollars.Value)-SUM(Fields!TwevleMonths.Value)

This is just junk data, but you can get the idea of how the report slots the inventory into the right aging based on the MonthDiff.

image

Now hide the details to show the correct aggregates for your report.

image

This is not as complex as some situations, but it’s nice to be able to filter out values from your query and aggregate the results without having to use custom code for to do the aggregation for every value that has an Iif statement.  I find this much cleaner, once you get the math right.

How to build a Weekly Report with Most-Recent-Day and Week-To-Date values Filtered correctly for Last Year

Not to beat a dead horse, but this is another SSRS aggregation situation against a cube data source that can be solved by math.  This is the third in a series, and I suspect there will be a few more, since each situation is different. 

You can get the concept from my previous posts Filter Zeros from a Percent Increase and Aggregating Last Child values.  This one is even more complicated, but I’ll give the quick and dirty version.

The client wants a report that allows the user to choose a week, and have report columns for the most recent day in that week (so it will be Saturday for all past weeks, and today for the current week), for the week-to-date, and for the full week.  This get tricky because some of the values in these sets of columns include most recent day Last Year, and week-to-date Last Year.  I can’t filter the data set because some of the columns need the full week values for Budget and for Last Year, even if we’re only part way through the week.  Below is a report with the weekdays toggled open so you can see exactly how the values are summing up for the groups.  Thursday is the most recent day in the week, so it is the only one included in the Thursday totals.  Sunday to Thursday are included in the Week-To-Date totals. 

image

To accomplish this I use math to zero out any unwanted values.  The math itself takes some thinking, and every situation is different. I put the values in a spreadsheet and play with them until I get the right combination.  Here is how I solved this one.

CREATE TWO FACTORS – Week-To-Date and Most Recent Day

The end goal is to create two multipliers, one for Most Recent Day, and one for Week To Date.  You will be able to use these multipliers on any measure in your data set to filter out unwanted values.  

The user can select a single week for the report.  The report dataset must contain the integer value of the Week Number out of the parameter select by the user.  **Note: this solution only works if the weeks in your cube are numbered uniquely and consecutively over time.  So the first week in your Date table should be week one (or whatever starting point you choose), and each week number thereafter should be greater than the last.

image

1. CREATE NEW FIELDS IN THE REPORT DATASET PROPERTIES

Double click on your dataset and go to the Fields tab in the Dataset Properties.  Click on the Add button and select Calculated Field.

image


2. FIRST WE FIND THE MAXIMUM DAY FOR THE SELECTED WEEK

Add the following Calculated Fields. The end goal is to create two multipliers, one for Most Recent Day, and one for Week To Date.  You will be able to use these multipliers on any measure in your data set to filter out unwanted values.  See Excel screenshot below for examples broken down for current week and previous week.

1. NowDay  – This gives me the day number of today from 1 to 7

=DatePart("w",Now(),FirstDayOfWeek.Sunday)

2. CurrentWk  – There is a hidden parameter  in the report defaulting to whatever the week number is of today.  Example today could fall in week # 319 according to my DIM_Time table. **

=Replace(Mid(Parameters!CurrentWeekID.Value,InStr(Parameters!CurrentWeekID.Value,"].&[")+4,10),"]","")

3. Floor  – The floor returns either a 1 or a 0.  It returns a 1 if the week selected is the current week, otherwise it returns 0. 

=FLOOR ( Fields!Fiscal_Week_ID.Value/Fields!CurrentWk.Value )

4. Ceiling – The ceiling returns either a 7 or a 0.  It returns a 0 if the week selected is the current week, otherwise it returns a 7.  I use a +1 to prevent a divide by zero.

=(CEILING( (Fields!CurrentWk.Value-Fields!Fiscal_Week_ID.Value) / (ABS(Fields!CurrentWk.Value-Fields!Fiscal_Week_ID.Value)+1) ))*7

5. MaxDayTW –This is the maximum day number (1 to 7) for the week selected.  If it is the current week it will be whatever number day of the week today is.  If is a past week it will return a 7.  So if today is Wednesday, and my week starts on Sunday, then MaxDayTW will be 4. The way it works is if the current week is selected then the Ceiling will be zero, and we will keep the  NowDay value.  If it is a past week, then the NowDay value will be zero’d out and the Ceiling will be 7, making it the MaxDayTW = 7, the last day of the week.

=(Fields!NowDay.Value*Fields!Floor.Value) + Fields!Ceiling.Value

6. MaxDayTW_Name – This gives the weekday name for the MaxDayTW that we calculated – Monday, Tuesday, etc. to be used in the column header of the report.

=WeekdayName(Fields!MaxDayTW.Value)

3. THEN WE CREATE THE MULTIPLIERS

Add the following calculated fields:

7. WeekToDate_multiplier – This will return a 1 or a 0.  It will be a 1 for all days which are less than or equal to the MaxDayTW, and zero out any unwanted days in the week-to-date.

=CEILING  (  FLOOR ( Fields!MaxDayTW.Value / Fields!Day_Of_Week_ID.Value ) / ( Fields!MaxDayTW.Value / Fields!Day_Of_Week_ID.Value )  )

8. MostRecentDay_multiplier – This will return a 1 or a 0.  It will be 1 for the most recent day of the week and a 0 for any other days of the week.

=FLOOR (Fields!Day_Of_Week_ID.Value /Fields!MaxDayTW.Value)*Fields!WeekToDate_multiplier.Value

image

image

image

4. USE THE MULTIPLIERS IN YOUR REPORT

You can either create additional calculated fields in your dataset, or you can just apply the multipliers directly in your report.  I prefer to use them in the report so I don’t have to track back to multiple places to find out exactly how a calculation is working.  Be sure to use the multiplier BEFORE aggregating, since you want to multiply the individual rows, not the aggregate.

Examples:

1. To get Most Recent Day Sales $ use this calculation:

=Sum(Fields!Sales_Dollars.Value*Fields!MostRecentDay_multiplier.Value

2. To get Week To Date Sales $ for Last Year use this calculation:

=Sum(Fields!Sls_Dollars_LY.Value*Fields!WeekToDate_multiplier.Value)

Here are the results. The weekdays are toggled open so you can see exactly how the values are summing up for the groups.  Thursday is the most recent day in the week, so it is the only one included in the Thursday totals.  Sunday to Thursday are included in the Week-To-Date totals.

image

This is not a simple solution, but once it is in place it is very simple to use.  It gets around all the complexities of having to use Custom Code to sum up each different measure for each different group in your report.  It also allows you to have repeating headers on each page rather than having to hold your table within a List to make the Custom Code work properly in all renderings.  Get the two multipliers right, and you can aggregate as many measures as you like without any hassle at all.

** It’s worth repeating that this solution only works if the weeks in your cube are numbered uniquely and consecutively over time.  So the first week in your Date table should be week one (or whatever starting point you choose), and each week number thereafter should be greater than the last.

How to Filter out Last Year Value from a Percent Increase aggregation when the Last Year value is less than or equal to Zero

This is a sister solution to my last post which describes how to use math to ignore unwanted values in a cube query for an SSRS report, but still be able to aggregate the resulting values.  IIF statements can’t be aggregated, and aggregations can’t be nested, but math can always be aggregated in SSRS.

A common requirement is to calculate a Percent Increase over Last Year (LY).  The Percent Increase calculation is:

=(This Year – Last Year) / Last Year

But what if you want to ignore all values in a row where LY <= 0?  You can hide the detail rows using an IIF statement in your report, but to sum and calculate the percentage at a group level all values will be summed.  If this Year (TY) is more than zero it will be included in the % calculation, even though LY was less than or equal to zero.  And if LY is less than zero it will also be included in the sum.  This will skew the results and not give the desired results.  For example:

image

image

The basic premise is that you want to zero out LY and TY in your calculation if LY <= 0.  Here’s how.

1. ADD A CALCULATED FIELD TO YOUR DATASET

Add a calculated field to your Dataset Query called “LY_Inc_Multiple”.  Right click on the report Dataset, select Dataset Properties, Select Fields, click on the Add button and select Calculated Field.

2. WRITE YOUR CALCULATION

We want to create a calculation that will produce either a 1 if LY is positive or a 0 if LY is zero or negative.  We can then use this to multiply the values in the aggregate percent calculation for the Group to exclude any unwanted values from the result. Here I will divide LY by the absolute value of itself, plus one. The ‘plus one’ is to prevent division by zero if LY is zero. Take the Ceiling of this calculation will give you a result of either 1 or 0.  

Click on the function button in the Field Source of your new LY_Inc_Multiple calculation.  Enter the following:

=(Ceiling(Fields!LY.Value/(ABS(Fields!LY.Value)+1)))

Here is how the calculation works, broken down step by step

image

3. USE YOUR CALCULATION IN THE REPORT

You can then go ahead and multiply your Increase Percent variables to zero out any unwanted values.  Be sure to use the LY_Inc_Multiple in your statement BEFORE summing.

For clarity, your calculation is this:

=(LY_Inc_Multiple*(TY-LY))/(LY_Inc_Multiple*LY)

In your report at the group level it manifests as this :

=Iif(Sum(Fields!LY_Inc_Multiple.Value*Fields!LY.Value)=0,"",((SUM(Fields!LY_Inc_Multiple.Value*(Fields!TY.Value-Fields!LY.Value))/Sum(Fields!LY_Inc_Multiple.Value*Fields!SunLY.Value))))

The IIF statement will hide any division by zero.

That’s basically it.  Each situation you come across will be slightly different, and you’ll need to think about the math you need for your particular situation.  It’s brain teaser for sure, but once you get the hang of it it can make report building much simpler.  You can avoid custom code solutions which have their own headaches, and you can control your summing and grouping without any funkiness.

SSRS – Aggregate LAST YTD or LAST CHILD Value in an SSAS query

Trying to aggregate an aggregate is not possible in SSRS.  You can write custom code to capture the running total of values in a report, which works, but can have unexpected behaviour when groups in your report change. It also prevents you from using some other SSRS functionality, for example repeating column headers on a page.

Here is an example of a solution that works using math, which doesn’t prohibit you from using any functionality, since SSRS has no trouble aggregating math equations.  This solution has many applications in filtering out unwanted values in a row.  I will show you an example where only the most recent (LAST) value of YTD is wanted for each group of rows in a query.

1.  In my cube, the YTD calculation requires a member of the “Week Period To Date” hierarchy to be selected.

Aggregate
(
  PeriodsToDate
  (
     [TIME].[Week Period To Date].[Fiscal Year],
     [TIME].[Week Period To Date].CurrentMember
  ),
[Measures].[Sales Dollars]
)

2. In my report, the user can select a range of weeks.  So I include the Week ID from the “Week Period To Date” hierarchy in the query in order to return results for YTD.  Notice that the YTD Sales grow incrementally each week. 

image

I can sum the Sales Units in the report, and my report Groups will capture the correct value when using Sum.  But to aggregate YTD across groups I want to capture only the LAST value.  In my detail I can select the last value for the detail group, but now I want to SUM these LAST values for the parent group.  SSRS gives an error when specifying SUM (LAST(Sls Un YTD)).  IIF statements can’t be aggregated either, not even from a calculated field in the query.

3.  The solution is so simple, it only took me 3 days to figure out.

First, I built the query against the cube as above, including the weeks and the YTD field from the cube.  Then I added a Calculated Field to the Dataset.  Right click on the report Dataset, select Dataset Properties, Select Fields, click on the Add button and select Calculated Field.

image

4. I added a calculated field for the last week in the range selected by the user.  The calc pulls the integer value of the Week Number out of the parameter select by the user.  ***Note: this only works if the weeks in your cube are numbered uniquely and consecutively over time.  So the first week in your Date table should be week one (or whatever starting point you choose), and each week number thereafter should be greater than the last.

=Replace(Mid(Parameters!ToTIMEFiscalWeekIDName.Value,InStr(Parameters!ToTIMEFiscalWeekIDName.Value,”].&[“)+4,10),”]”,””)

5.  Now the magic.  I added a calculated field called Sls_Un_YTD_calc.  I always name my calculations whatever the altered measure name is plus “_calc”.  This makes it very easy to use/replace in fields and calculations in the report.  Here is the calculation.

=Floor(Fields!Fiscal_Week_ID.Value/Fields!ToWeek.Value)*Fields!Sls_Un_YTD.Value

Simple, right?  This basically says, whatever week you are looking at, if it’s the last week in the selected range then muliply the YTD by One otherwise multiply it by Zero.  By dividing the week in the row, but the maximum week in the range, you will either get One for the last week, or less than one for any other week.  Taking the Floor of this value makes anything less than one into zero.  Ta da!  You have successfully zeroed out any unwanted values from your dataset, and in your report you can sum away to your hearts content.