Promoting Excel Tabular Model to SSAS

PowerPivot for Excel is a fantastic addition to Microsoft’s Business Intelligence offering.  It provides a self-service capability for users to mash-up huge amounts of data from multiple sources, create advanced calculations that get refreshed alongside their pivot tables and the ability to very easily publish workbooks as web applications.  Excel users are already comfortable with the interface.  And the PowerPivot add-in is free for Excel 2010 and 2013 users. 

There are pros and cons to using any one of PowerPivot for Excel, PowerPivot for SharePoint, SSAS Tabular or SSAS multidimensional.  Melissa Coates has written a great article on when to use which type of model. While PowerPivot for Excel is a fairly robust and flexible tool for individual users, there are many reasons why you might promote an Excel Tabular model to SQL Server Analysis Services. 

PowerPivot for Excel can be a great starting point for users to decide what information they want to include in a model. It allows them to play with the data and refine the model until it houses the main information that they need to see on a regular basis, in a format they can easily consume.  What can happen is that the workbooks get emailed around and get out of synch between users.  Or the data gets too large and the model takes forever to refresh.  Or the in-memory calculations take too long to load.

When this happens you might want to promote your Excel Tabular model to SSAS, if your infrastructure supports it.  It means the flexibility for users to mash-up additional data is lost, but the gains in stability, scalability, security and other features can be well worth the move.  Microsoft has made this promotion of a model very easy to do.

1. Create a new SSAS Project

Open up SQL Server Data Tools.  In the File menu click New and then Project.  In the New Project dialog box, under Installed Templates expand Business Intelligence and select Analysis Services.  On the right select Import from PowerPivot.

Browse for a location and enter a name for your project, and then click OK.

image_thumb1

In the Tabular model designer dialog you can enter the SSAS instance you will use for model.  It will need to be an SSAS instance running in Tabular mode.

image_thumb3

In the Open dialog box select the PowerPivot model for Excel that you will be converting to SSAS.

image_thumb5

It will take a minute or two to load the model into the project.

2. Check and refine your model

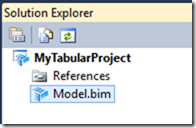
In the solution explorer, double click on the Model.bim top open up the imported model. 

image_thumb6

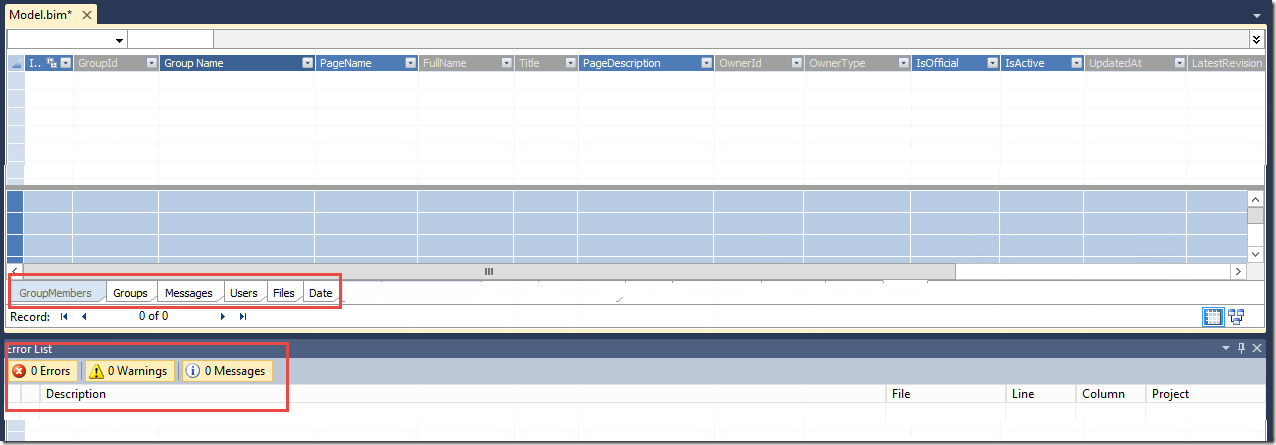
You will see the tabs similar to the PowerPivot model near the bottom of the screen, and any warnings, errors or messages. 

image_thumb8

Here you can do any edits to your model.  The interface is very similar to PowerPivot.  You can delete, hide or show data tabs from Client Tools by right clicking on the tab. 

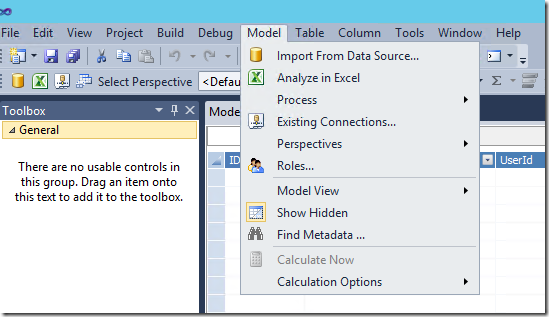
You can manage the model from the Model menu.

image_thumb12

You can edit the table properties and manage the relationships from the Table menu.

image_thumb10

You can add, edit and manage calculations and columns within the table tab.

image_thumb14

3. Deploy the Model to Analysis Services

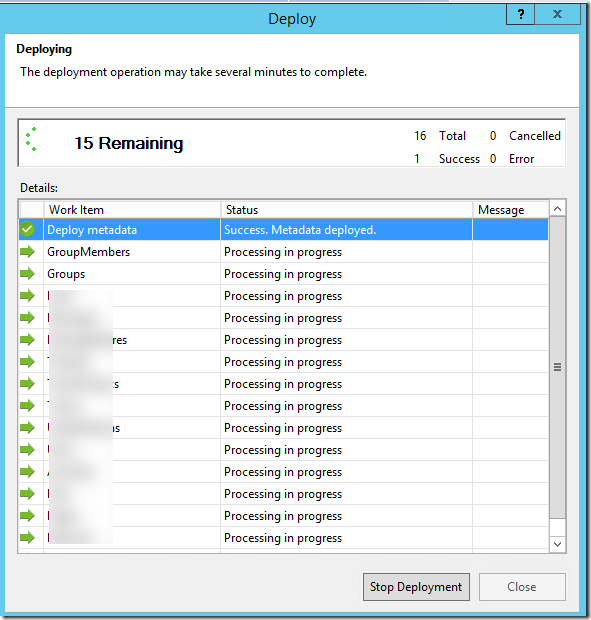
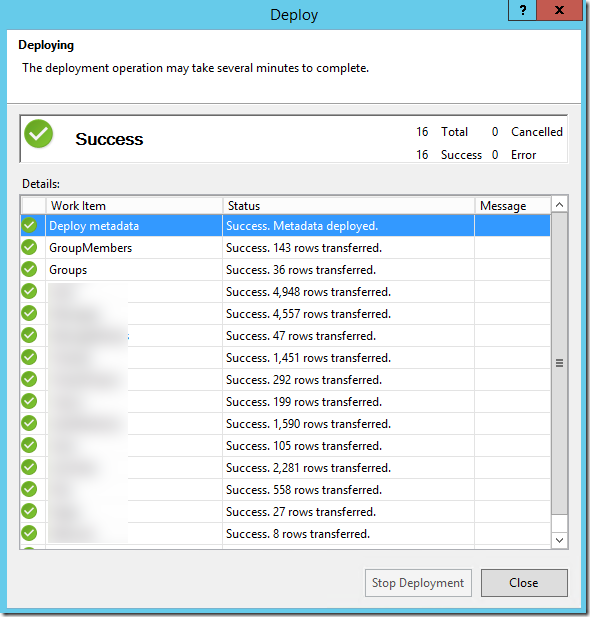
From the Build menu, you can build and deploy your model.  You can troubleshoot any deployment issues by following the error messages that pop up in the Deployment dialog in the Message column.

SNAGHTML103f7068_thumb1

image_thumb16

4.  Connect to your SSAS Tabular Model

You can connect to the model through Excel or SSMS or any other client tool that can consume an SSAS model.  In Excel, you won’t be using PowerPivot, rather you will be using the SSAS Tabular model as a direct data source.

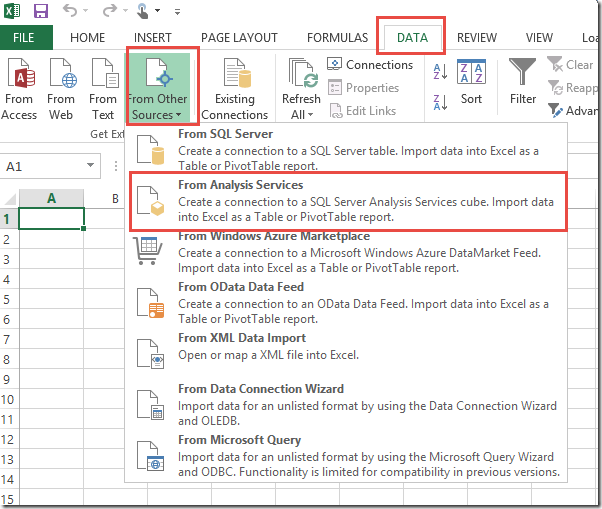
In Excel, click on the Data tab, click on From Other Sources and then From Analysis Services.

image_thumb22

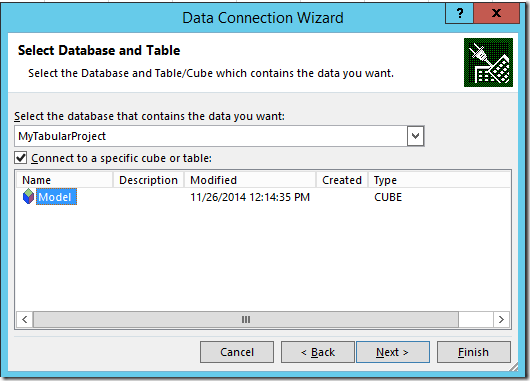
Enter the server name where you deployed your model, then select the database and model that you deployed.

image_thumb24

You can now use this as a classic Pivot Table data source.


I’ve noticed that the Tabular model is not as robust or responsive as the multi-dimensional model when you get to larger sets of data.  This is because it does everything in memory.  The converse of this is also true for smaller sets.  Because it is in-memory it can retrieve information and do calculations more quickly for smaller data sets.  Multi-dimensional models have additional features that Tabular does not have.  Richard Lees did an interesting comparison of Tabular vs Multidimensional.

As mentioned at the beginning of this article, the flexibility of PowerPivot can be exchanged in favour of the stability and scalability of a traditional SSAS deployed model.  Having users develop their own tabular models in PowerPivot and then have I.T. manage and deploy it to a wider audience allows for a great partnership and a quick development cycle.

Manually Deploy SSRS Reports to SharePoint

I have a situation where there is an alternate authentication method in place on SharePoint and deploying reports using the Visual Studio deployment options won’t work.  To get around this while they sort it out I have manually loaded the reports, data sources and shared datasets to SharePoint.  There were a few tricks which I would like to remember so I’ll post them here.

1. Create 3 document libraries:

The first thing I did was create three libraries, one for Reports, one for Shared Datasets and one for Shared Data Sources.  You don’t have to have separate libraries, but I find it more user friendly to keep these items separate.  I don’t want users weeding through data sets and data sources to get to their reports.  Here is how to create these libraries.  The one surprise is to use a content type of Report Builder Report for the Shared Datasets.  I imagine this is to allow you to configure your Dataset to connect to a Data Source.

2. Create (don’t upload) the Data Source.

Navigate to the Data Source library you created. From the Documents tab select New Document.  Do not try to upload a data source you have already created for your report, since, for whatever reason, SharePoint won’t recognize it as a Report Data Source. You need to recreate it.  

image

Configure the data source appropriately. Choose “Stored Credentials” to allow for proxy authentication, and select “Use as Windows credentials”.  Click on the Test Connection button to be sure it is working.  Click OK.

image

3. Upload the Shared Datasets:

Navigate to your Shared Datasets library and from the Documents tab you can “Upload Document” or  “Upload Multiple Documents” depending on how many shared datasets you have. 

image

4. Connect the Shared Datasets to the Data Source:

Connect the shared datasets to the appropriate data source.  Click the drop down beside the dataset and select “Manage Data Sources”.

image

Click on the “DataSetDataSource”, which will have the yellow caution triangle to let you know it has not been configured.

image

Click on the ellipsis and navigate to wherever you created the data source in SharePoint. 

image

Click OK and click Close.  Do this for all the Shared Datasets you uploaded.

5. Upload the Report:

Navigate to the Report library you created.  From the Documents tab select Upload Document and upload your Report Services report.

6. Connect the Report to the Data Source:

From the drop down beside the report select “Manage Data Sources”.

image

Same as step 4, click on the name of the data source that needs to be connected.  Click on the ellipsis and navigate to where the data source is stored in SharePoint.  Click OK. Click Close.

7. Connect the Report to the Shared Datasets:

From the drop down beside the report select “Manage Shared Datasets”

image

From the list of dataset names which need to connected, click on the first one which has a yellow caution triangle beside it.  This lets you know that the dataset has not yet been connected. 

image

Click on the ellipsis and navigate to where you have stored your shared datasets.  Select the dataset.  Click OK. Repeat this for any shared datasets which have not been connected.  Click Close.

You are ready to view your report.  If you get any data source errors, check that the Shared Datasets are all connected correctly to the data source, as well as the report.

Automate Deployment of SSIS Packages on SQL 2005

After much playing with SSIS packages I worked out how to Automate Import of Packages to File System using SQL to write out a dtutil batch file.  Then I worked on how to deploy packages back out to the SQL store from the file system. I imagine it might have been accomplished in a similar fashion as the import using a For Each File loop.  Instead I came across a very simple solution for deploying packages to the SQL Store. There is a free CODEPLEX download called BIDS Helper. It doesn’t even require an install,  It’s just an Add In for Visual Studio.

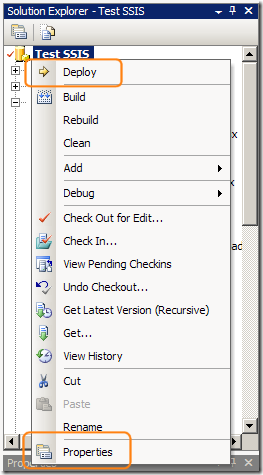
Simply download the appropriate zip file version from here and unpack it into your My DocumentsVisual Studio <version>Addins folder. Close and reopen BIDS and the deploy functionality is there.

clip_image001

More detailed instructions on using it are here.

**Please note, if you have passwords embedded in your packages and want the ability to automatically deploy while maintaining the correct protection level you might want to use Package Configurations to maintain the passwords.  In this way the passwords won’t get stripped from the package on deployment since they will be stored in SQL Server or elsewhere.